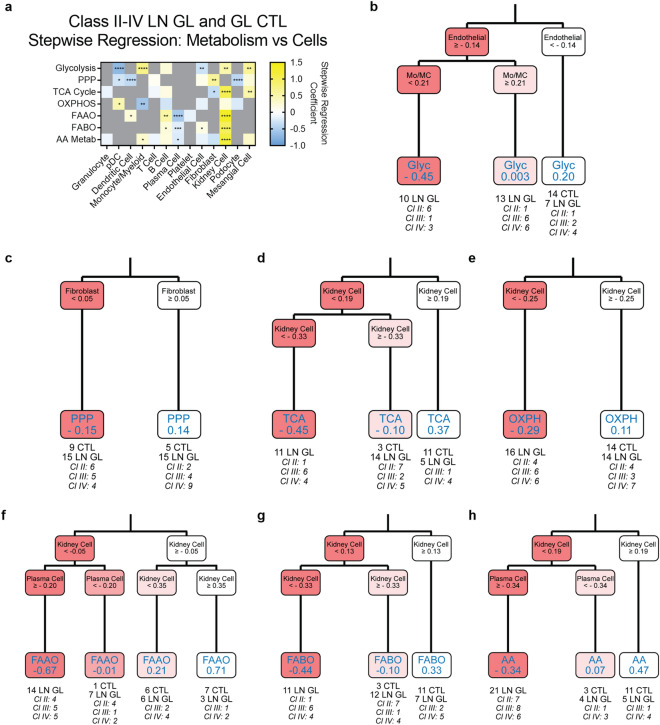
Figure 4.
Metabolic gene expression changes in LN GL are associated with changes in the EC, kidney cell, and fibroblast gene signatures. (a) Stepwise regression coefficients and (b–h) CART analysis for metabolic pathway signatures in all glomerular LN samples and CTLs. Values in the final CART leaves for each process represent the average GSVA score of samples that were assigned to that leaf. Each resulting CART decision tree was pruned once. For all calculations, the following sample numbers were used: LN GL [CTL (n = 14), Cl II (n = 8), Cl III/IV (n = 22)]. Significant p-values in (a) reflect significant coefficients in the stepwise regression model. *, p < 0.05; **, p < 0.01; ***, p < 0.001; ****, p < 0.0001.

