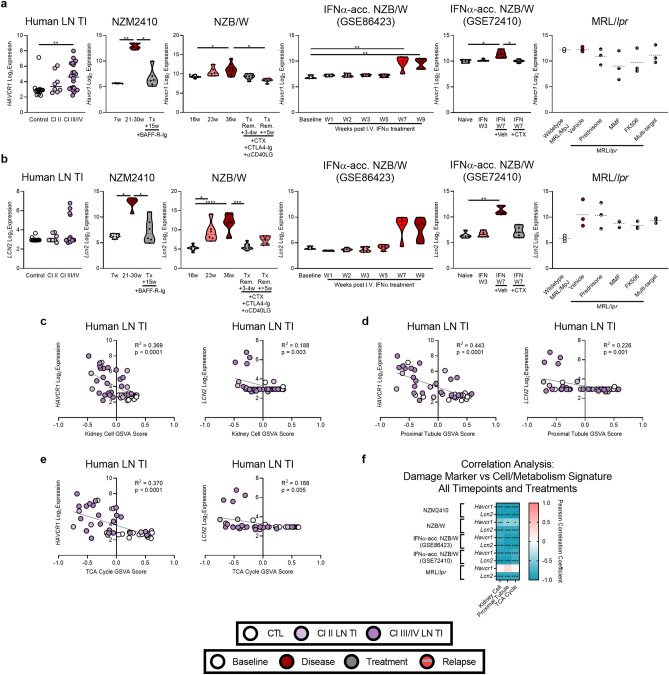
Figure 8.
Cellular and metabolic gene expression changes correlate with expression of genes indicating tubular damage in human and murine LN. Log2 expression of (a) HAVCR1/Havcr1 and (b) LCN2/Lcn2 in human LN TI and the kidneys of (NZM2410 (GSE32583, GSE49898), NZB/W (GSE32583, GSE49898), IFNα-accelerated NZB/W (GSE86423), IFNα-accelerated NZB/W (GSE72410), and MRL/lpr (GSE153021) mice. Each point represents an individual human or mouse. Significant differences in gene expression at each timepoint compared to disease were evaluated in the human TI with Welch’s t-test and in murine models with the Mann–Whitney U test. Linear regression between HAVCR1/Havcr1 and LCN2/Lcn2 expression and kidney cell, proximal tubule, and TCA cycle GSVA scores in all samples for (c–e) human and (f) murine LN. For all calculations the following sample numbers were used: LN TI [CTL (n = 15), Cl II (n = 8), Cl III/IV (n = 22)], NZM2410 [6w (n = 5), 21-30w (n = 5), Tx + 15w (n = 6)], NZB/W [16w (n = 8), 23w (n = 6), 36w (n = 10), Tx Remission + 3-4w (n = 8), Tx Remission + > 5w (n = 6)], IFN-accelerated NZB/W (GSE86423) [Baseline (n = 3), W1 (n = 5), W2 (n = 5), W3 (n = 5), W5 (n = 5), W7 (n = 5), and W9 (n = 5)], IFN-accelerated NZB/W (GSE72410) [Naïve (n = 5), IFN W3 (n = 5), IFN W7 + Veh (n = 5), IFN W7 + CTX (n = 5)], and MRL/lpr [Wildtype (n = 3), Vehicle (n = 3), Prednisone (n = 3), MMF (n = 3), FK506 (n = 3), Multi-target (n = 3)]. Significant p-values in (c–f) reflect significantly non-zero slopes determined by linear regression or correlation analysis. *, p < 0.05; **, p < 0.01; ***, p < 0.001; ****, p < 0.0001.

