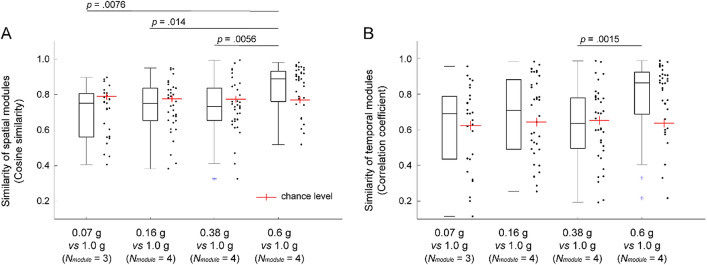
Figure 7.
Structural change in the modules. The similarity of the spatial (A) and temporal (B) modules between the gravity condition of 1 g and each of the remaining gravity levels was calculated across all pairs of modules that were matched to each other by maximizing the cosine similarity between each spatial module pair and the correlation coefficient between each temporal module pair. Each dot indicates the similarity of each module pair, and the boxplot represents their distribution. The red crossed line indicates the chance level.

