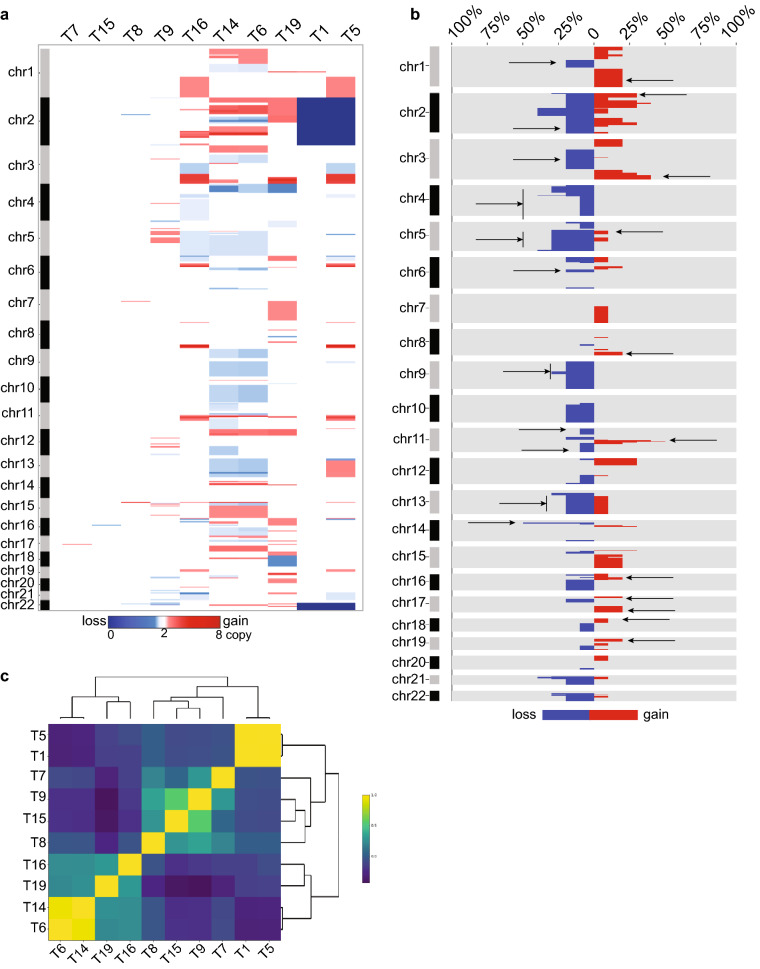
Figure 3.
SCNAs in AA ESCC genomic regions encode cancer-related genes. (a) SCNA region profiles by 1 MB were visualized using CNApp. Dark blue represents homozygous deletion (copy number 0), white represents diploid (copy number 2), red represents copy number gains (the darkest red is copy number 8). (b) SCNA region frequency plot shows the percentage of samples with gains (red), losses (blue), and no alteration (gray) across chromosomes. Arrows represent the regions that also found in the 17 AA ESCC cohort analysis. (c) Plot shows the hierarchical clustering for samples correlation by Pearson correlation. Pearson r correlation coefficient r = 1 is yellow, r = − 1 dark navy color.

