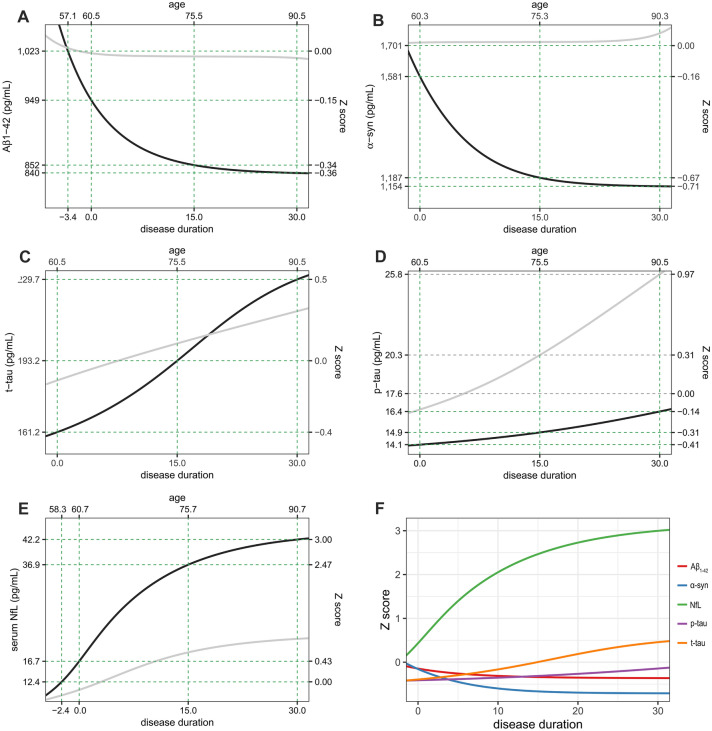
Figure 2.
Estimated trajectories of biofluid markers in PD (black line) and control groups (gray line) as function of time. The temporal trajectories were acquired by modified Euler’s method for solving the first order differential equation. Temporal trajectories of CSF Aβ1-42 and α-syn show negative exponential pattern with suspicious plateau (A,B), while those of the CSF t-tau and p-tau, and serum NfL show steady increase pattern (D) or sigmoid appearance (C,E). Z score change in serum NfL was the largest within biofluid markers (F). Figures are illustrated using ggplot2 and patchwork packages in R software. Aβ1-42 amyloid-β1-42; α-syn α-synuclein; t-tau total tau; p-tau phosphorylated tau; NfL neurofilament light chain.

