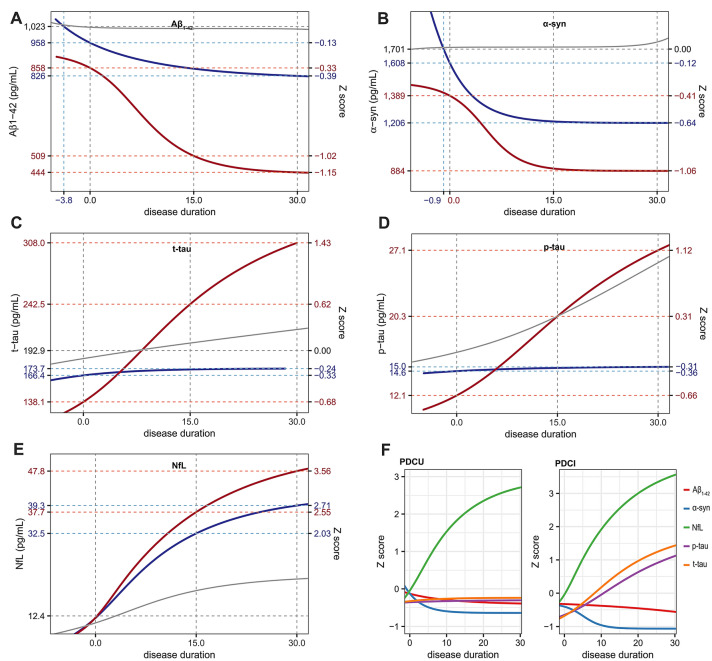
Figure 3.
Temporal trajectories of biomarkers in PD patients with and without cognitive impairment at baseline. PD patients with cognitive impairment (red lines) show greater change in all five biomarkers (A: Aβ1-42, B: α-syn, C: t-tau, D: p-tau, E: NfL) across the disease course than those without (blue lines). NfL showed the most remarkable changes both in PDCU and PDCI groups (F). Gray lines represent temporal trajectories in control group. Figures are illustrated using ggplot2 and patchwork packages in R software. Aβ1-42 amyloid-β1-42; α-syn α-synuclein; t-tau total tau; p-tau phosphorylated tau; NfL neurofilament light chain.

