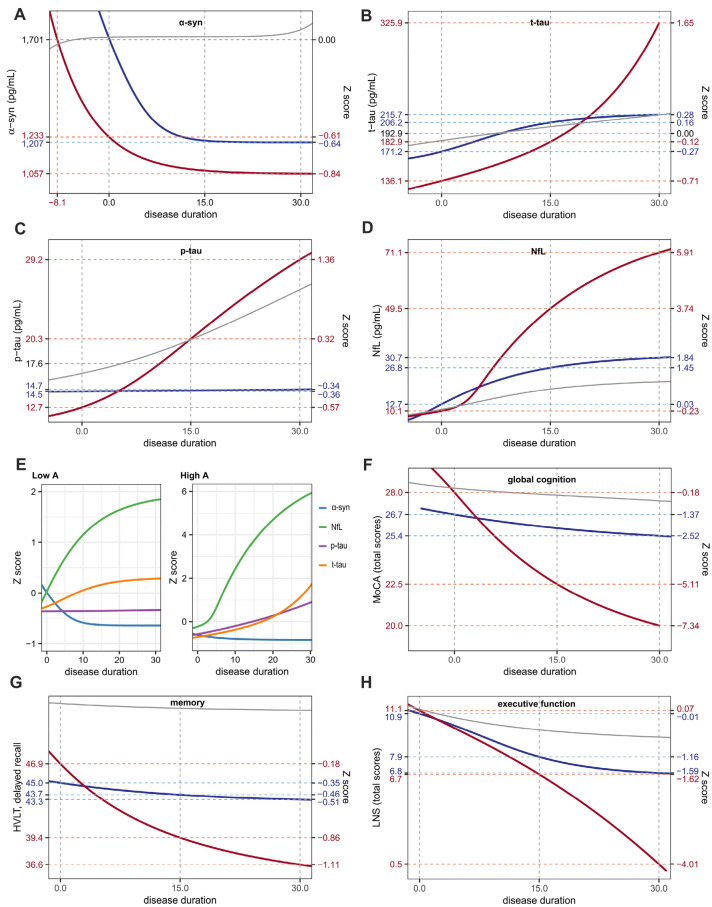
Figure 4.
Temporal trajectories of biomarkers and cognitive performances in PD patients with high and low CSF Aβ1-42 at baseline. PD patients with low CSF Aβ1-42 levels (red lines) show greater change in four biomarkers (A: α-syn, B: t-tau, C: p-tau, D: NfL) and cognitive decline (F: global cognition, G: memory, H: executive function) across the disease course than those with high CSF Aβ1-42 (blue lines). NfL showed the greater changes in the temporal trajectory among biomarkers (E). Gray lines represent temporal trajectories in control group. Figures are illustrated using ggplot2 and patchwork packages in R software. α-syn α-synuclein; t-tau total tau; p-tau phosphorylated tau; NfL neurofilament light chain; MoCA Montreal Cognitive Assessment; LNS Letter-Number Sequencing test; HVLT Hopkins Verbal Learning Test.

