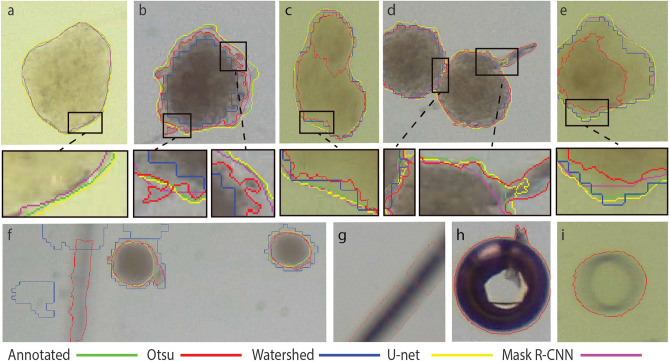
Figure 5.
Brightfield images of spheroids with various shapes and sizes. Images contain results of 4 different segmentation methods and the annotated ground truth with color codes: green—ground truth; red: Otsu threshold; blue: watershed; yellow: U-net; magenta—Mask R-CNN. (a–e) Selected results and enlarged regions. In (a), only deep learning methods could find the spheroid. In (d), we can observe that the U-net is not able to completely differentiate two very close spheroids. In (c), thresholding identifies one spheroid as two because of the intensity changes. (f–i) Artifacts made by thresholding and watershed. These are usually out of focus spheroids, borders of the plates, plastic errors in plates, or air bubbles.

