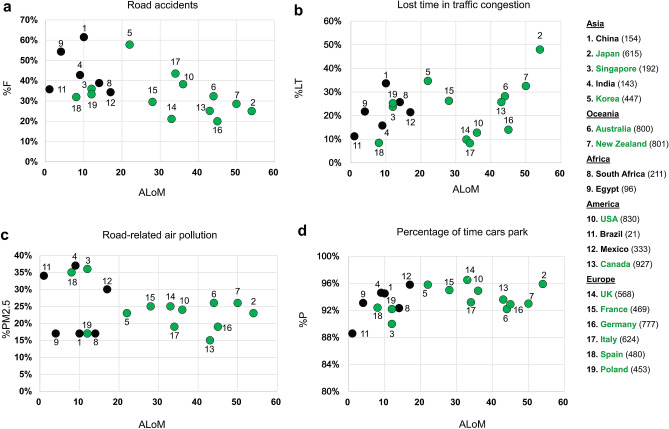
Figure 1.
Measures of damages and detrimental impact of road traffic (Supplementary Tables 1 and 8). (a) %F is the percentage of road accident fatalities out of the total death rate from accidents of any kind. The ALoM, represents the active level of PC motorization, relates to nonstop (24/7) PCs per 1000 inhabitants. Data points and the list of 19 countries are marked in black for developing countries and green for developed countries. The number in parentheses for each country is the level of PC motorization per 1000 inhabitants, LoM. (b) %LT is the percent of lost time in traffic congestion out of total commuting time. (c) %PM2.5 is the percent of this type of air pollution from road traffic, from the total %PM2.5 produced. (d) %P is the average percentage of time PCs spend parked.

