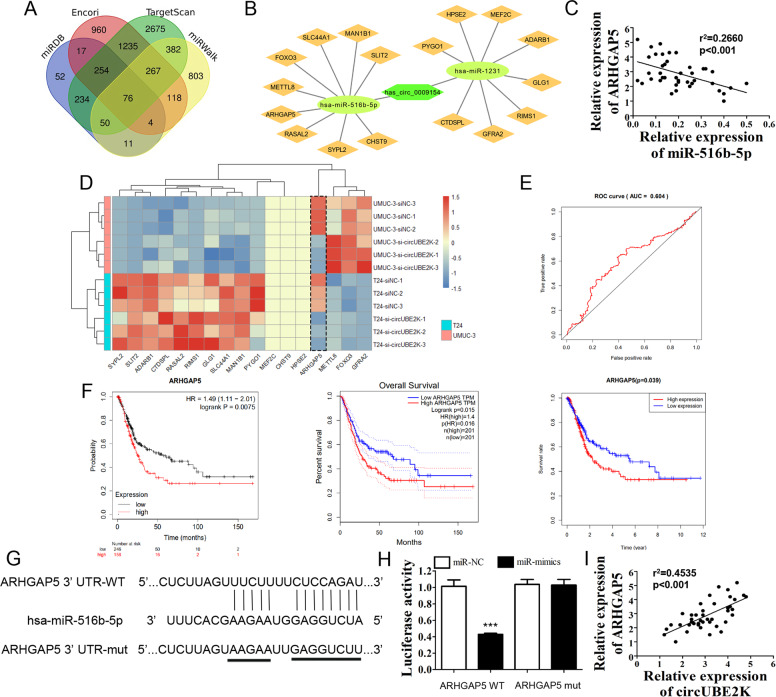
Fig. 4. ARHGAP5 was the down-stream target of miR-516b-5p, and it could predict BC prognosis.
A Venn diagram showed potential down-stream targets of miR-516b-5p predicted by miRDB, Encori, TargetScan and miRWalk. B Diagram of ceRNA network showed circUBE2K/miR-516b-5p/ARHGAP5 axis. C Scatter plot presented negative correlation between expression level of miR-516b-5p and ARHGAP5 in BC tissues (n = 42, r2 = 0.2660, P < 0.001). D Potential down-stream gene expression levels were carried out by qRT-PCR. Heatmap illustrated 17 candidate gene expression level in UM-UC-3 and T24 transfected with siNC and si-circUBE2K (Z-Score scaled). E Time-dependent receiver operating characteristic (ROC) curve showed efficacy of ARHGAP5 expression level predicting BC 3-year OS. The area under curve (AUC) was 0.604. F Kaplan–Meier plots for BC patients’ OS, based on ARHGAP5 expression level (Left: Kaplan-Meier Plotter; Middle: GEPIA; Right: TCGA database). G Binding site of ARHGAP5 3′-UTR and miR-516b-5p was predicted by Interactome. The third row showed mutated ARHGAP5 3′-UTR sequence for further dual-luciferase reporter assay. H Luciferase activity were measured 3 days after co-transfection with ARHGAP5 (ARHGAP5 WT)/mutated ARHGAP5 (ARHGAP5 MUT) and miRNA mimics negative control (miR-NC)/hsa-miR-516b-5p mimics (miR-mimics) in HEK-293T cells. Error bars indicate SD (***P < 0.001 vs. vehicle). I Scatter plot presented positive correlation between expression level of circUBE2K and ARHGAP5 in BC tissues (n = 42, r2 = 0.4535, P < 0.001).

