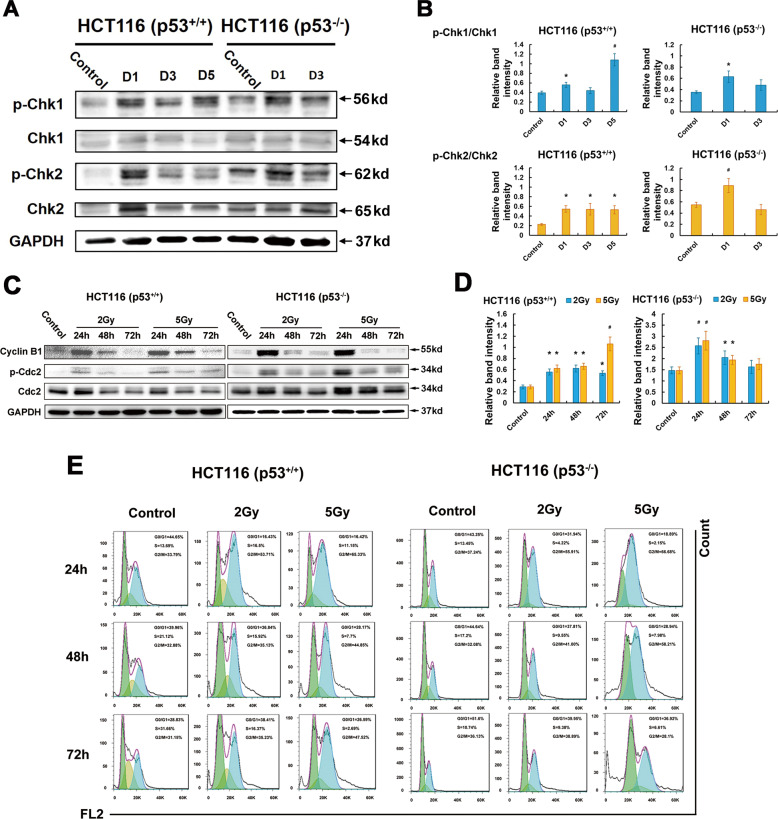
Fig. 2. Effect of CIR on the phosphorylation of Chk1, Chk2, and Cdc2 in irradiated p53+/+ and p53−/− cells.
A The relative band intensities for p-Chk1, Chk1, and for p-Chk2, Chk2. D represents Day. B The panel shows the relative band intensities for p-Chk1 and Chk1 and for p-Chk2 and Chk2. Blue columns and yellow columns indicate p-Chk1/Chk1 and p-Chk2/Chk2, respectively. Data are expressed as the mean ± SE. *p < 0.05; #p < 0.01. C G2-M checkpoint alteration in p53+/+ and p53−/− HCT116 cells detected by immunoblots of Cyclin B1 and p-Cdc2 following 2 Gy and 5 Gy CIR. D The relative band intensities for p-Cdc2 and Cdc2. Data are expressed as the mean ± SE. *p < 0.05; #p < 0.01. E CIR-induced cell cycle arrest in p53+/+ and p53−/− cells for 24, 48, and 72 h using flow cytometry. No less than 72 h prolonged arrest at G2-M phase was observed in p53+/+ cells.

