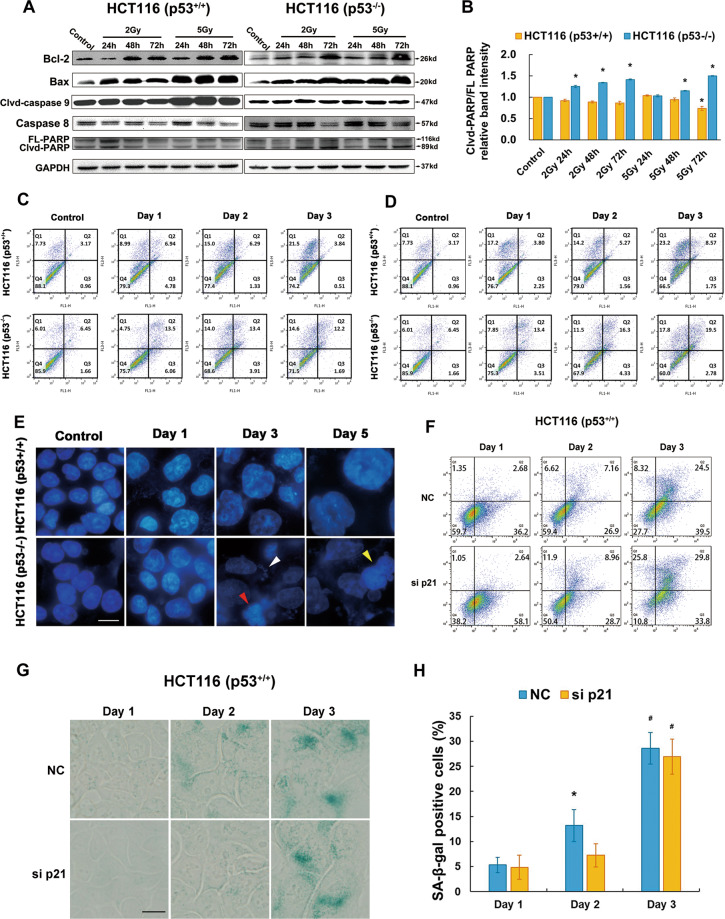
Fig. 4. Apoptotic resistance in p53+/+ HCT116 cells and mitotic catastrophe prevailing in p53−/− HCT116 cells.
A Immunoblots to detect key proteins involved in apoptotic pathways, including Bcl-2, Bax, caspase-9, caspase-8 and PARP activation upon 2 Gy and 5 Gy CIR. B Quantification of cleaved-PARP (clvd-PARP)/full length PARP (FL-PARP) was performed via densitometric analysis of the western blot technique. Data are expressed as the mean ± SE. *p < 0.05. C, D Apoptosis was evaluated with Annexin V/PI double staining using FACS at day 1, 2, and 3 in p53+/+ and p53−/− cells after 2 Gy (C) and 5 Gy (D) irradiation. E Mitotic catastrophe was measured with DAPI staining at day 1, 3, and 5. Scale bar: 10 µm. F Dot plots of p53+/+ cells after Annexin V/PI double staining assay. Cells were transfected by NC and p21 siRNA for 48 h then treated by 5 Gy CIR. G Senescent cells were determined with β-galactosidase staining. Cells were detected in p21 silencing p53+/+ cells compared with NC cells at day 1, day 2, and day 3 after 5 Gy CIR. Sample staining was set at day 1, day 2, and day 3 considering the tendency of cells to fall out when they grow for a long time. Scale bar: 10 µm. H Senescent fractions were detected in p21 silencing p53+/+ cells compared with NC cells at day 1, day 2, and day 3 after 5 Gy CIR. The percentage is represented as the mean ± SE of three independent experiments. *p < 0.05; #p < 0.01.

