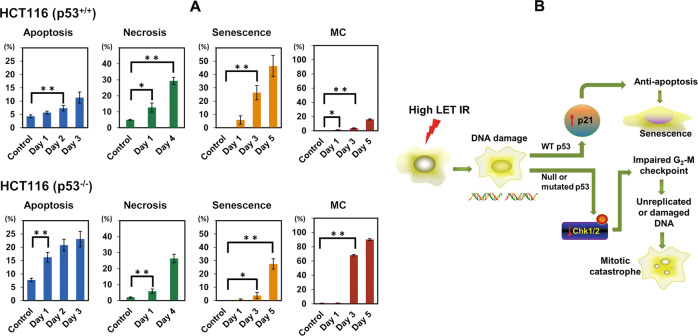
Fig. 5. Statistical analysis of cell death modalities in p53+/+ and p53−/− cells following 5 Gy CIR and schematic illustration of predominant cell death modalities in isogenic HCT116 cells after CIR.
A Data are presented as the mean ± standard error (SE) of three independent experiments. *p < 0.05; **p < 0.01. Note that the percentages in the ordinate are shown in different scales for the different death modes. MC represents mitotic catastrophe. B Schematic illustration to describe the predominant cell death mechanism of isogenic HCT116 cells after CIR.

