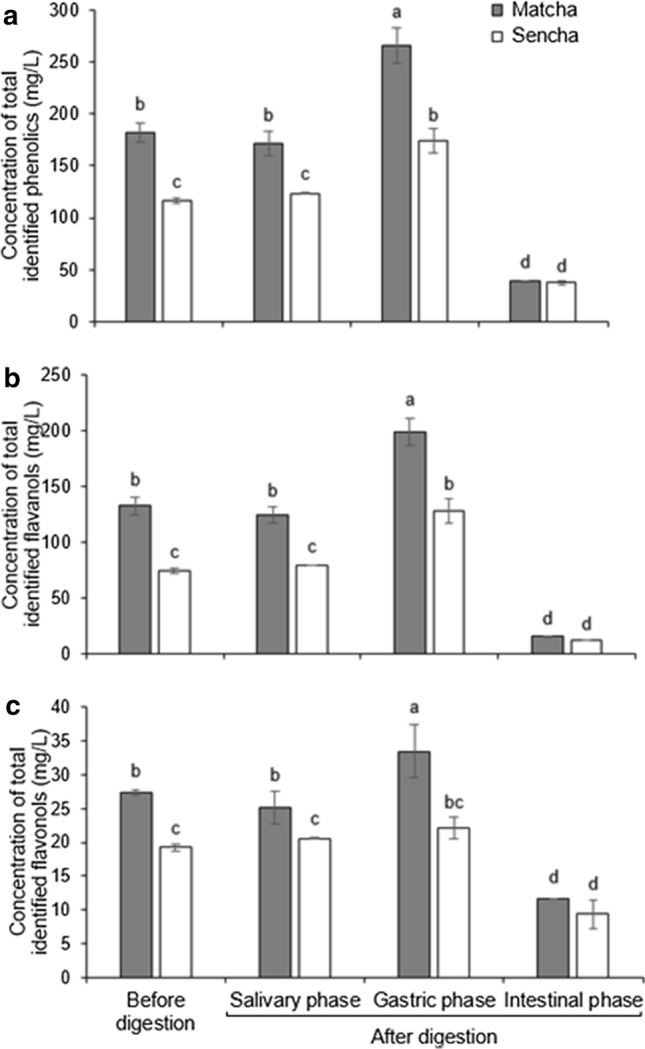
Fig. 5.

The concentration of a total identified phenolic compounds, b total identified flavanols and c total identified flavonols before and after in vitro digestion phases of Matcha and Sencha green tea. Data are means of three replicates ± SD. Different small letters indicate significant difference between Matcha and Sencha digestion phases at p ≤ 0.05
