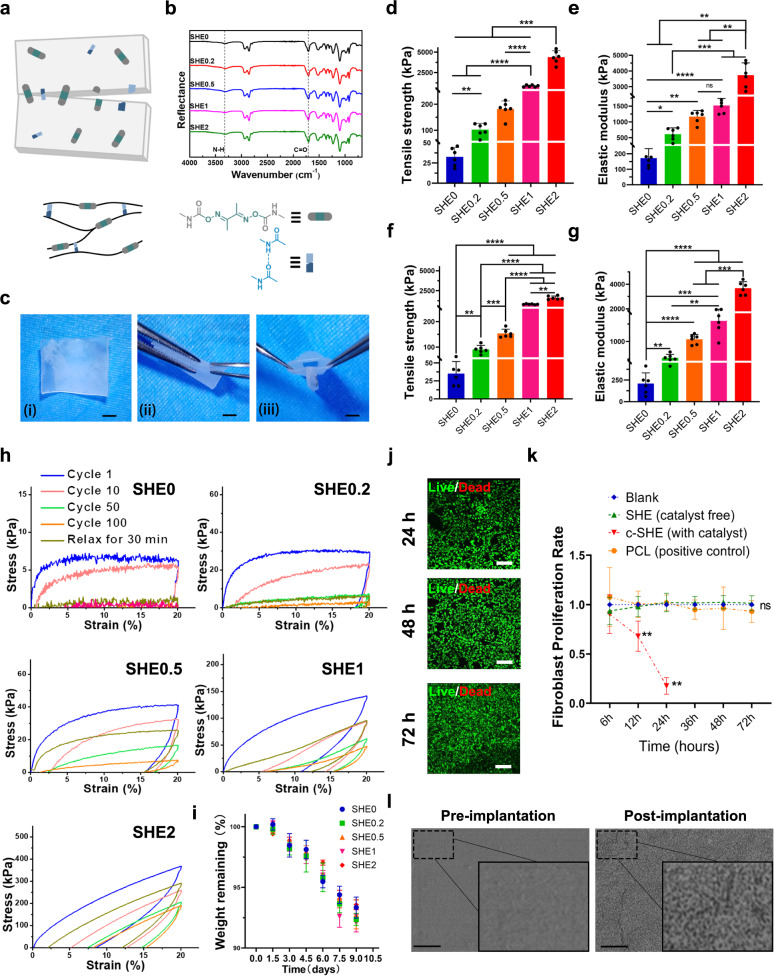
Fig. 2. Pattern diagram of structure of SHEs, mechanical test, ex vivo degradation and biocompatibility analysis.
a Molecular structure, schematics and b ATR-FTIR spectra of SHEs. c In vitro self-healing property demonstration, scale bar = 1 mm. Histogram shows the d tensile strength and e elastic modulus of SHEs, n = 6 in each group. Histogram shows the f tensile strength and g elastic modulus of healed SHEs (self-healing for 5 min at room-temperature), n = 6 in each group. h Cyclic tensile curves of SHEs at 20% strain. There was no waiting time between two consecutive cyclic tensile (cycle 1–cycle 100). The film was then allowed to relax for 30 min at 25 °C before the 101st cyclic tensile test. i In vitro enzymatic degradation of SHEs in CE solution at 37 °C, n = 3 in each group. j Live and dead staining of areolar fibroblast cell co-cultured with SHE (using SHE2) on 24, 48 and 72 h, each experiment was repeated three times. scale bar = 150 μm. k Proliferation rate of areolar fibroblast cell co-cultured with c-SHE (with catalyst, as a negative control), SHE (using SHE2) and PCL (as a positive control) respectively on 6, 12, 24, 48 and 72 h (n = 5 in each group). l Scanning electron micrograph of SHE (using SHE2) before subcutaneous degradation experiment (pre-implantation) and on day 35 of subcutaneous degradation experiment (post-implantation). The surface of SHE arose the appearance of micro-holes after 35-day implantation in vivo. Each experiment was repeated three times, scale bar = 2 μm. Data were presented as mean ± s.d. Brown–Forsythe ANOVA test with Dunnett’s multiple comparison test d–g was used for comparing tensile strength and elastic modulus in groups before and after self-healing. Tensile strength before self-healing (d): SHE0, SHE0.2, SHE0.5 and SHE1 compared to SHE2, ***p = 0.0003, 0.0003, 0.004 and 0.0009, respectively; SHE0 compared to SHE0.5, ***p = 0.003; SHE0 compared to SHE0.2, **p = 0.0034; SHE0.5 compared to SHE1, ****p < 0.01; Elastic modulus before self-healing (e): SHE0 and SHE0.2 compared to SHE2, **p = 0.006 and 0.008, respectively; SHE0.5 and SHE1 compared to SHE2, **p = 0.0019 and 0.0044, respective; SHE0 compared to SHE0.2, *p = 0.0153; SHE0 compared to SHE0.5 **p = 0.002; SHE0.5 compared to SHE1, ns p = 0.1318; SHE0 compared to SHE1, ****p < 0.0001; Tensile strength after self-healing (f): SHE0.5, SHE1and SHE2 compared to SHE0, ****p < 0.0001; SHE0.5 compared to SHE0.2, ***p = 0.0005; SHE1and SHE2 compared to SHE0.2, ****p < 0.0001; SHE1and SHE2 compared to SHE0.5, ****p < 0.0001; SHE0 compared to SHE0.2, **p = 0.0015; Elastic modulus after self-healing (g): SHE0.5, SHE1 and SHE2 compared to SHE0, ****p < 0.0001; SHE0.5 and SHE1 compared to SHE2, ***p = 0.0002 and 0.0002, respectively; SHE0 compared to SHE0.2, **p = 0.048; SHE0 compared to SHE0.5, ****p < 0.0001; SHE0 compared to SHE1, ***p = 0.0002; SHE0.2 compared to SHE1, **p = 0.0045. Ordinary one-way ANOVA test with Tukey’s multiple comparisons test (k) was used for evaluation of fibroblast proliferation rate. SHE (catalyst free) group and PCL group compared to blank group, ns p > 0.999; SHE (catalyst free) group compared to PCL group, ns p = 0.995; Elastomer (with catalyst) compared to blank group, **p = 0.002; Elastomer (with catalyst) compared to SHE (catalyst free) group, **p = 0.002; Elastomer (with catalyst) compared to PCL group, **p = 0.0024; Source data are provided as a Source Data file. SHE self-healing elastomer, PCL polycaprolactone, c-SHE containing catalyst self-healing elastomer.

