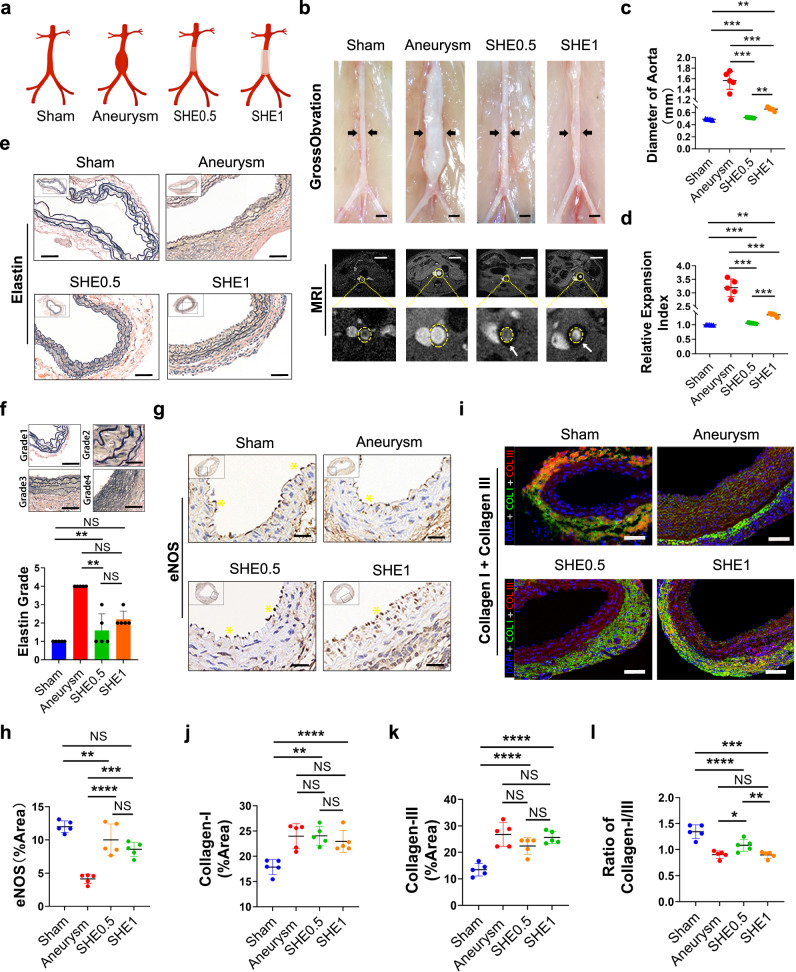
Fig. 3. Pattern diagram of grouping, Gross observation and MRI angiography of abdominal aorta, HE staining, EVG staining of aorta wall structure and immunofluorescence staining of aorta wall on collagen I/III.
a Pattern diagram shows the grouping of this part. b Gross observations and MRI scanning results of aorta in each group. The blood vessels pointed by the black arrow in the gross observation pictures are the abdominal aortas, scale bar = 1 mm. Of the MRI scanning, inside the yellow dotted circle is the abdominal aorta, while the black circular area pointed by the white arrow is the elastomer wrapped around the artery, scale bar = 5 mm. c Statistical plot of the maximum diameter of abdominal aorta in each group (n = 5 in each group). d Statistical plot of the relative expansion index of abdominal aorta in each group (n = 5 in each group). e Elastica van gieson (EVG) staining on wall of aorta. Elastin inside the normal arterial wall is stained with dark brown multi-circle intact rings, each experiment was repeated three times. Elastin inside the aneurysm is broken and incomplete, scale bar = 50 μm. f Panel f shows the subjective criteria for elastin grade and statistical histogram of elastin grade, n = 5 in each group, scale bar = 20 μm. g Endothelial nitric oxide synthase (eNOS) staining performed on aorta wall. The dark brown particles on the surface of vascular endometrium and pointed by the yellow * are nitric oxide synthase, scale bar = 30 μm. h Statistical plot of the expression of eNOS of abdominal aorta in each group (n = 5 in each group). i Immunofluorescence staining of collagen I (green) and collagen III (red) on aorta wall, scale bar = 50 μm. j–l Panels show the statistical plot of the expression of collagen I, collagen III and the ratio between collagen I and III, respectively (n = 5 in each group). Data were presented as mean ± s.d. Brown–Forsythe ANOVA test with Dunnett’s multiple comparison test (c, d) was used for comparing diameter of aorta in groups. Diameter of aorta (c): Sham compared aneurysm, ***p = 0.0006; Sham compared to SHE0.5, **p = 0.0046; Sham compared to SHE1, ***p = 0.0004; Aneurysm compared to SHE0.5, ***p = 0.0007; Aneurysm compared to SHE1, **p = 0.0013; SHE0.5 compared to SHE1, **p = 0.0022; Relative expansion index (d): Sham compared aneurysm, ***p = 0.0005; Sham compared to SHE0.5, **p = 0.0044; Sham compared to SHE1, ***p = 0.0007; Aneurysm compared to SHE0.5, ***p = 0.0005; Aneurysm compared to SHE1, ***p = 0.001; SHE0.5 compared to SHE1, ***p = 0.0005. Kruskal–Wallis test with Dunn’s multiple comparisons test (f) was used for elastin grading. Sham compared to aneurysm, ***p = 0.0009; Sham compared to SHE0.5, ns p > 0.9999; Sham compared to SHE1, ns p = 0.2593; Aneurysm compared to SHE0.5, *p = 0.0251; Aneurysm compared to SHE1, ns p = 0.4614; SHE0.5 compared to SHE1, ns p > 0.9999. Ordinary one-way ANOVA test with Tukey’s multiple comparisons test (h, j, k, l) was used for evaluation of eNOS expression and collagen expression in groups. eNOS expression (h): Sham compared aneurysm, **p = 0.0011; Sham compared to SHE0.5, **p = 0.001; Sham compared to SHE1, ***p = 0.0058; Aneurysm compared to SHE0.5, ns p > 0.9999; Aneurysm compared to SHE1, ns p = 0.8488; SHE0.5 compared to SHE1, ns p = 0.8233; Collagen-I expression (j): Sham compared aneurysm, **p = 0.0011; Sham compared to SHE0.5, **p = 0.001; Sham compared to SHE1, ***p = 0.0058; Aneurysm compared to SHE0.5, ns p > 0.9999; Aneurysm compared to SHE1, ns p = 0.8488; SHE0.5 compared to SHE1, ns p = 0.8233; Collagen-III expression (K): Sham compared aneurysm, ****p < 0.0001; Sham compared to SHE0.5, **p = 0.0021; Sham compared to SHE1, ****p < 0.0001; Aneurysm compared to SHE0.5, ns p = 0.1792; Aneurysm compared to SHE1, ns p = 0.9389; SHE0.5 compared to SHE1, ns p = 0.4169; Ratio of collagen-I/III expression (l): Sham compared aneurysm, ****p < 0.0001; Sham compared to SHE0.5, **p = 0.004; Sham compared to SHE1, ****p < 0.0001; Aneurysm compared to SHE0.5, ns p = 0.0525; Aneurysm compared to SHE1, ns p = 0.9995; SHE0.5 compared to SHE1, *p = 0.0425. Source data are provided as a Source Data file. eNOS endothelial cell nitric oxide synthase, NS no significance.

