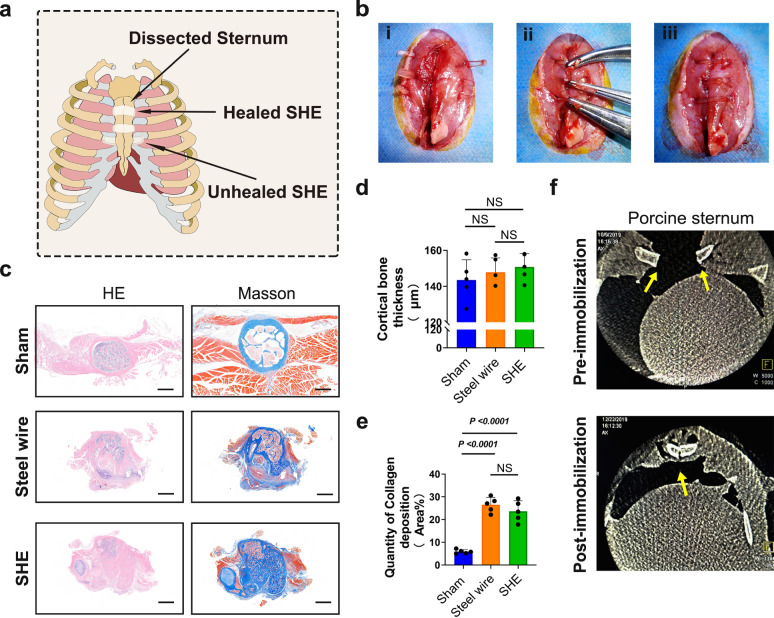
Fig. 5. Pattern diagram of sternum immobilisation by elastomer, surgical procedure of immobilisation, HE and Masson trichrome staining of sternum, spinal X-ray imagination of porcine sternum.
a Pattern diagram of sternum immobilisation by elastomer. b Surgical procedure of sternum immobilisation by elastomer in rat. c HE staining of rat sternum in sham, control and elastomer group. Masson staining of rat sternum in sham, steel wire and SHE group (blue part represented the deposition of collagen in sternum bone), scale bar = 500 μm. d Statistical scatter diagram of cortical bone thickness of rat sternum in sham, control, elastomer group (n = 5 in each group). e Statistical scatter diagram of collagen deposition of rat sternum in sham, control, elastomer group (n = 5 in each group). f Spinal X-ray imagination of porcine sternum (cross section) before and after immobilisation, respectively. High density shadows of sternum were marked with yellow arrows. Data were presented as mean ± s.d. Ordinary one-way ANOVA test with Tukey’s multiple comparisons test (d, e) was used for analysis of cortical bone thickness and quantity of collagen deposition. Cortical bone thickness (d): Sham compared to Steel wire, ns p = 0.7406; Sham compared to SHE, ns p = 0.4386; Steel wire compared to SHE, ns p = 0.8631; Quantity of collagen deposition (e): Sham compared to Steel wire, ****p < 0.0001; Sham compared to SHE, ****p < 0.0001; Steel wire compared to SHE, ns p = 0.3908. Source data are provided as a Source Data file. NS no significance.

