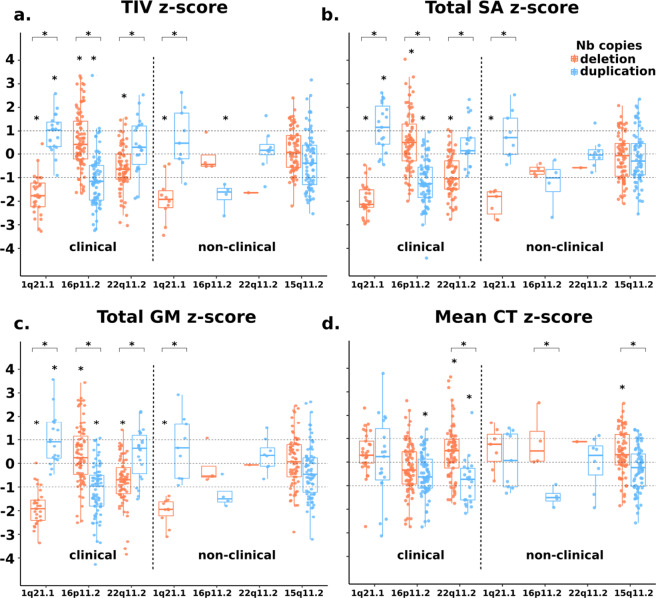
Fig. 1. 1q21.1, 16p11.2, 22q11.2, and 15q11.2 exert rich effects on global brain measures.
Total intracranial volume (a), total surface area (b), total grey matter volume (c) and mean cortical thickness (d) for clinically and non-clinically ascertained CNVs. Z scores for clinically and non-clinically ascertained CNVs were calculated using 331 and 965 controls, respectively, adjusting for age, age2, sex and site as a random factor. Y axis values are z scores. X axis are CNV groups. Significant difference between CNV group and corresponding control group is indicated with a star. Horizontal bars with stars show significant differences between deletions and duplications within the same locus. TIV total intracranial volume, SA surface area, GM grey matter, CT cortical thickness.

