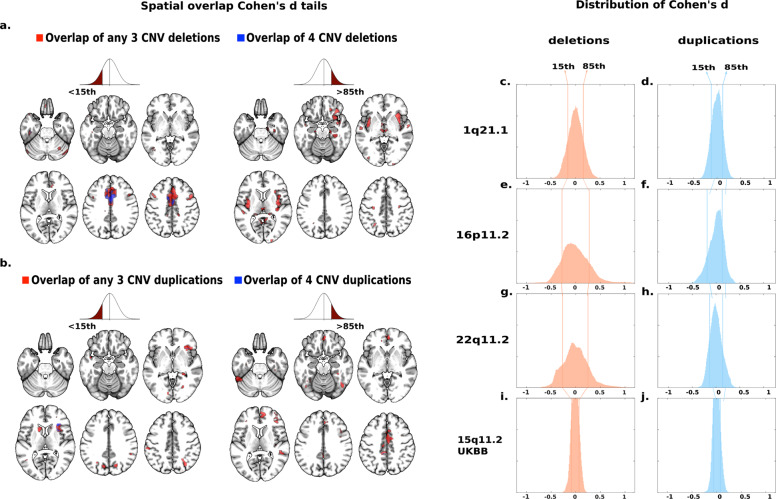
Fig. 3. Spatial overlap across deletions and duplications at four genomic loci.
Spatial overlap across clinically and non-clinically ascertained deletions (a) and duplications (b) at four genomic loci shown separately for <15th and >85th percentile of Cohen’s d values. Overlap of all four deletions (a) or all four duplications (b) is shown in blue. Overlaps of any combination of three deletions (a) or any combination of three duplications (b) are shown in red. Top ranking Cohen’s d values used in (a, b) are presented on the density plots for all eight deletions and duplications: 1q21.1 (c, d), 16p11.2 (e, f), 22q11.2 (g, h), 15q11.2 (i, j). The x axes values of the eight density plots are Cohen’s d. Corresponding maps for surface area and cortical thickness are reported in Supplementary Figs. 6 and 7.

