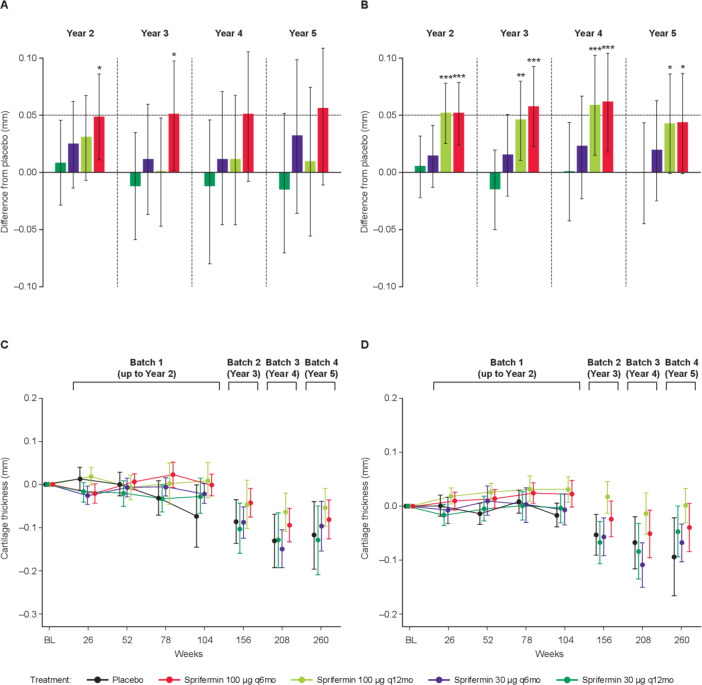
Figure 3.
Change in MFTC and LFTC cartilage thickness up to year 5. Difference from placebo in cartilage thickness (mm) in the (A) MFTC and (B) LFTC for the mITT population (n=494). Absolute change from baseline in (C) MFTC and (D) LFTC cartilage thickness (mm) for the SAR (n=161). Means and 95% CIs shown. *p<0.05, **p<0.005, ***p<0.001. BL, baseline; LFTC, lateral femorotibial compartment; MFTC, medial femorotibial compartment; mITT, modified intention to treat; q6mo, every 6 months; q12mo, every 12 months; SAR, subgroup at risk; TFTJ, total femorotibial joint.

