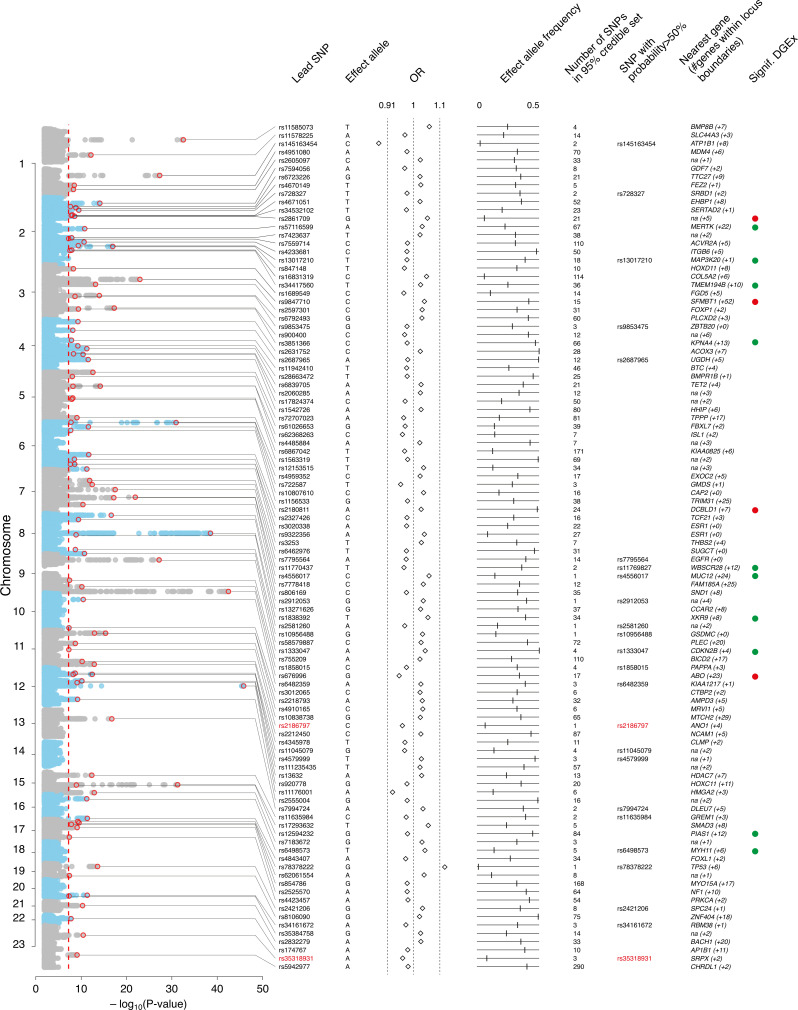
Figure 1.
Annotation of 102 haemorrhoidal disease (HEM) genome-wide association study (GWAS) risk loci. From left to right: Manhattan plot of GWAS meta-analysis results, (genome-wide significance level—P Meta <5×10⁻⁸—indicated with vertical dotted red line); Lead single nucleotide polymorphism (SNP)—marker associated with the strongest association signal from each locus (also annotated with a red circle in the Manhattan plot); Effect allele—allele associated with reported genetic risk effects (OR), also always the minor allele; OR with respect to the effect allele; Effect allele frequency—frequency of the effect allele in the discovery dataset; Number of SNPs in 95% credible set—the minimum set of variants from Bayesian fine-mapping analysis that is >95% likely to contain the causal variant; SNP with probability >50%—single variant (if detected) with >50% probability of being causal (coding SNPs highlighted in red); Nearest gene (#genes within locus boundaries)—gene closest to the lead SNP (if within 100 kb distance, otherwise ‘na’) and number of additional genes positionally mapped to the locus using FUMA (online supplemental table 2 and online methods). Signif. DGEx—locus containing HEM genes differentially expressed in RNA Combo-Seq analysis of HEM affected tissue, detected at higher (green) and/or lower (red) level of expression (see online methods).

