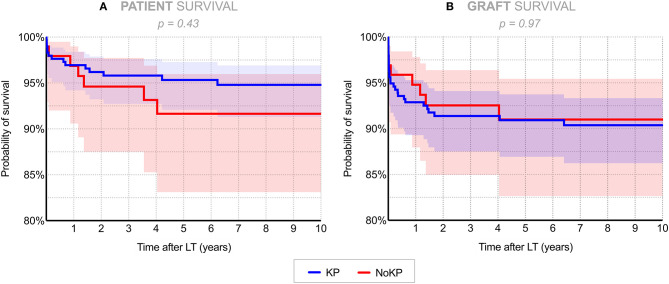
Figure 3.
Overall (A) patient and (B) graft survival rates in 296 recipients after previous KP vs. 97 without KP (Kaplan–Meier analysis). Shaded areas represent 95% confidence intervals. KP, Kasai procedure (patient with previous Kasai operation); NoKP, No Kasai procedure (patients without previous Kasai operation).

