
Figure 1.
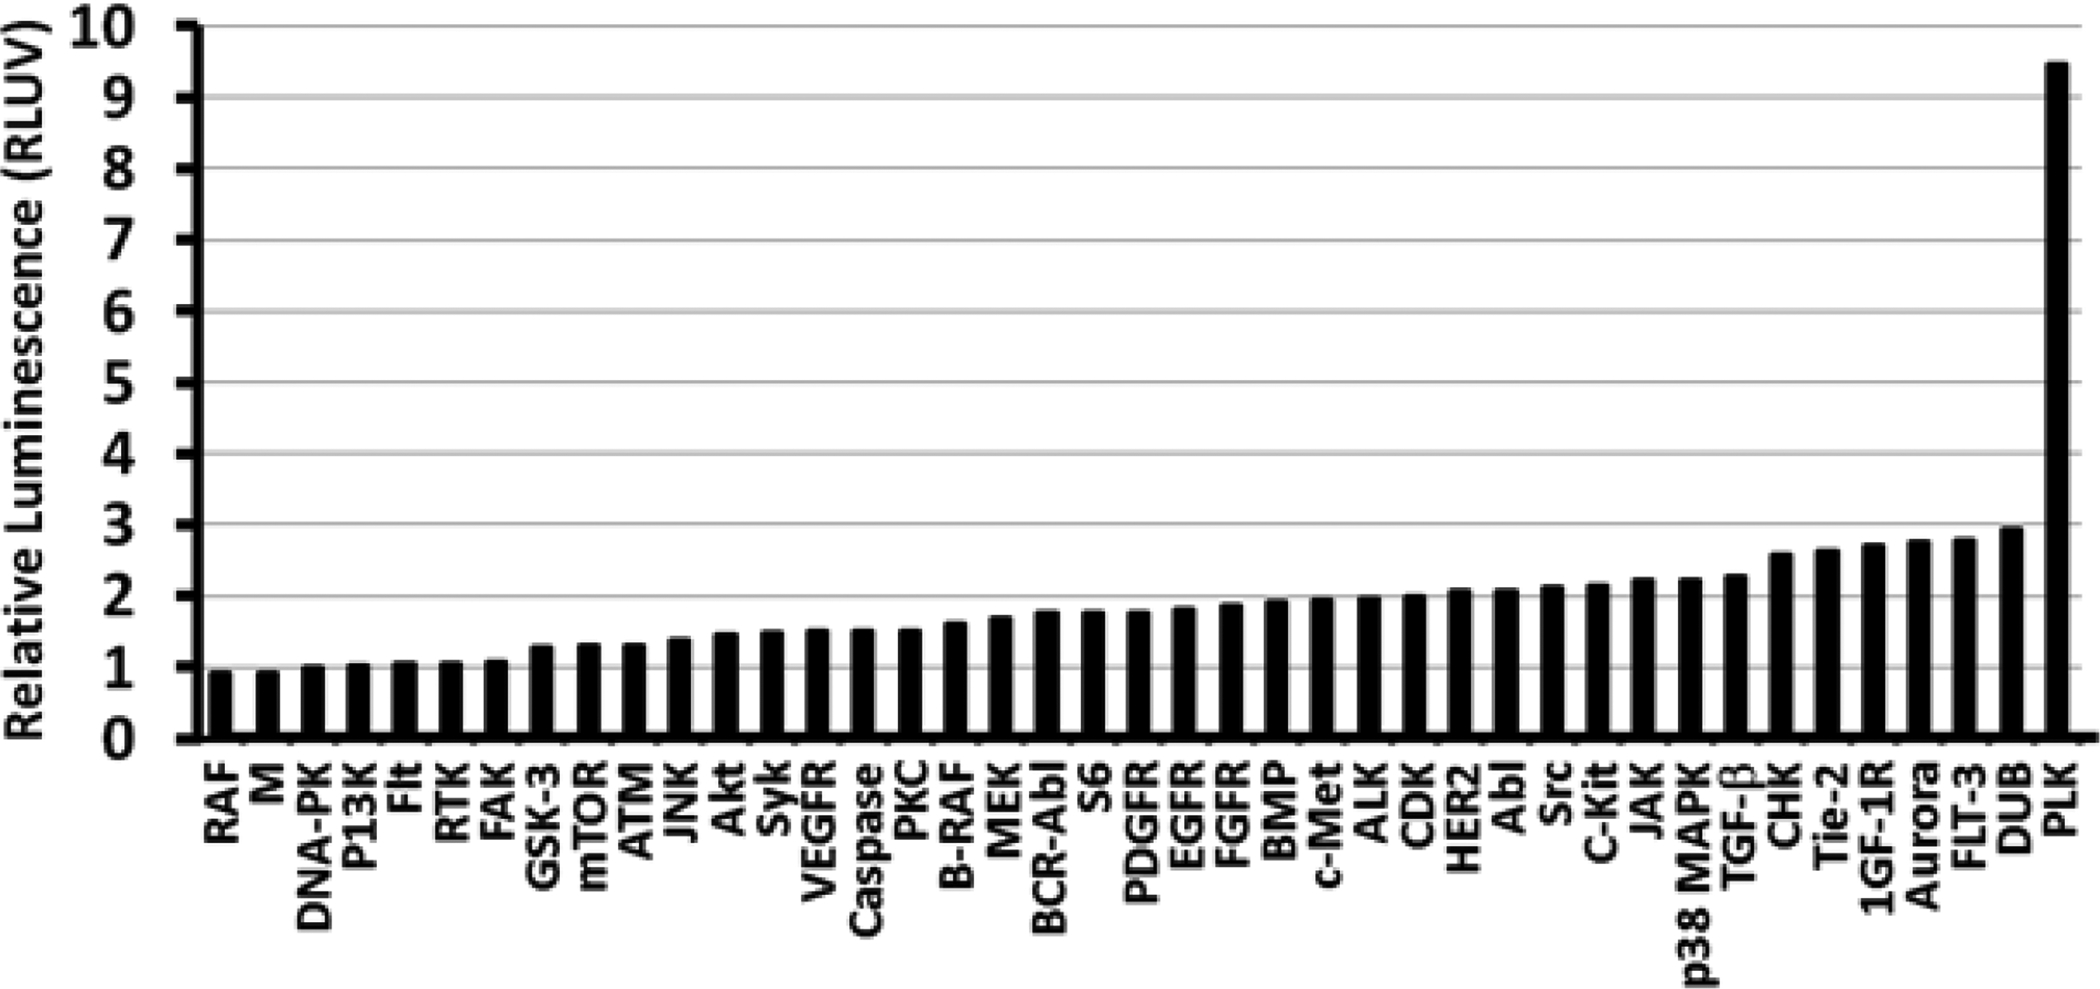
Identification of kinase targets that influence transgene expression. The enhancement values of individual inhibitors with the same kinase target were pooled together to prepare this figure. The y-axis shows enhancement relative to the polyplex control (RLUV = 1), while the x-axis indicates the kinase enzyme targeted by the inhibitor(s).