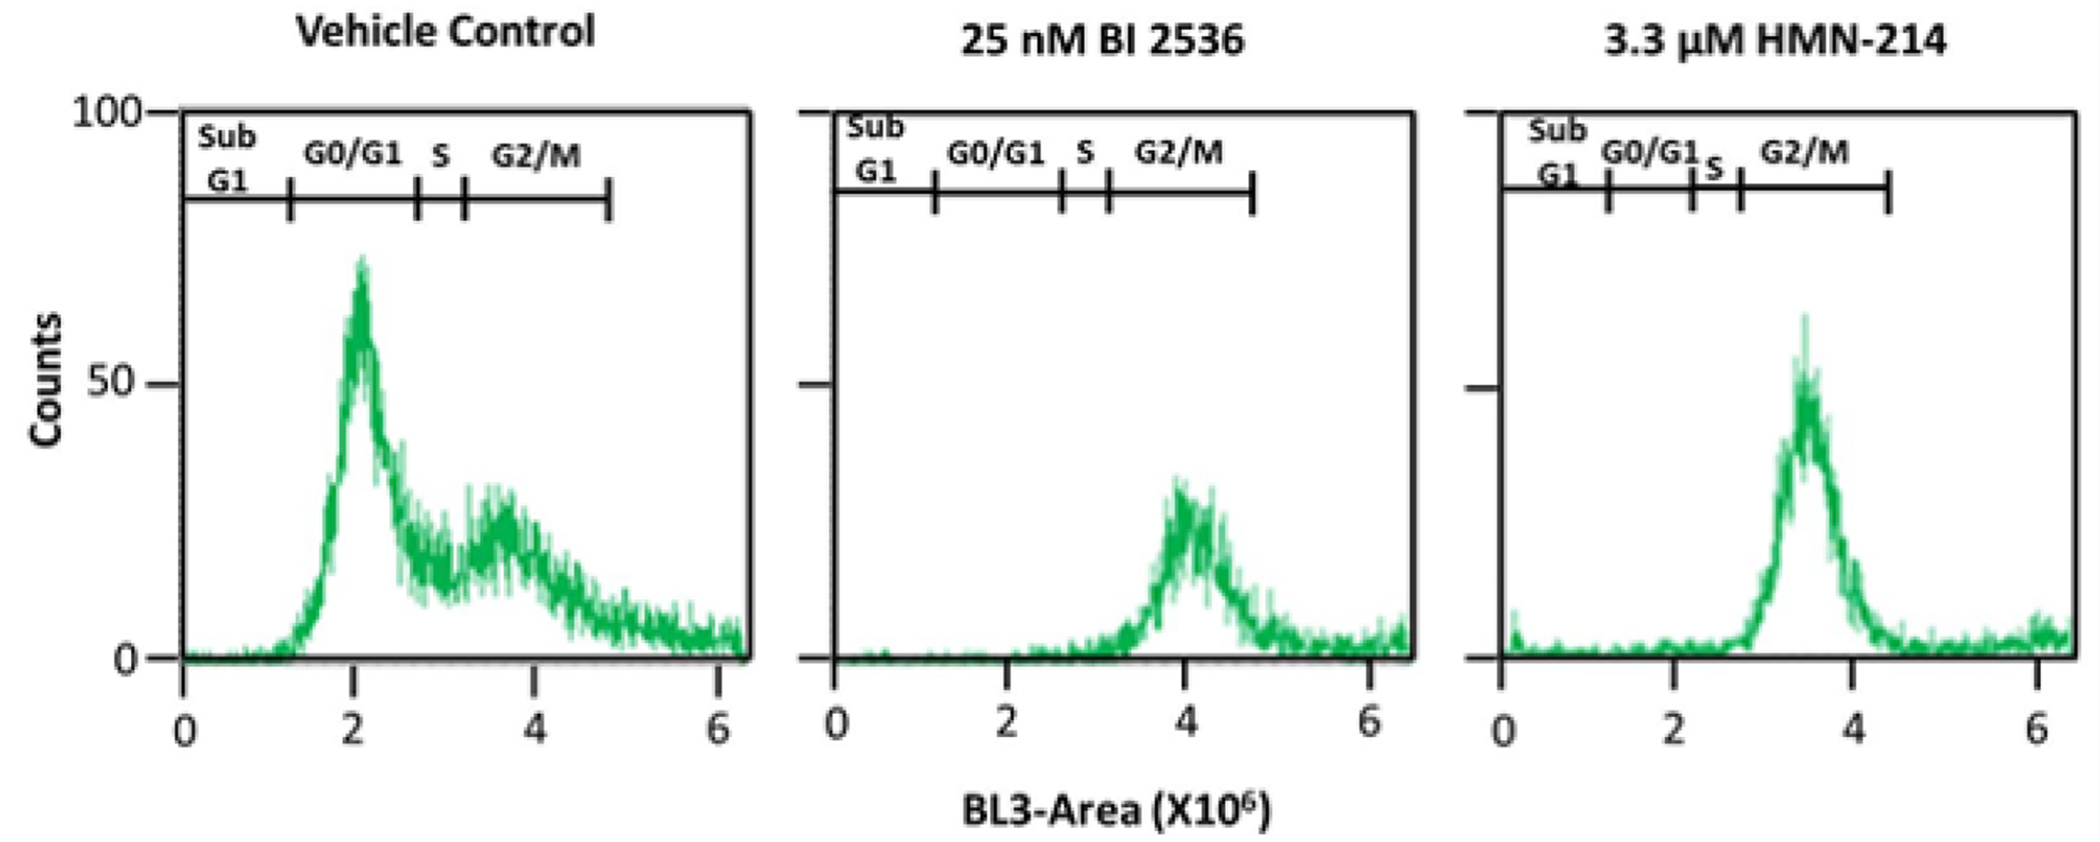
Figure 6.

Cell cycle analysis of PC3-PSMA cells treated with vehicle control (DMSO), 25 nM BI 2536, or 3.3 μM HMN-214 using flow cytometry and staining with propidium iodide (PI). Results from one representative experiment out of N = 3 independent experiments are shown. The y-axis (counts) indicates the number of cells with the specific fluorescence intensity shown on the x-axis (BL3-A).
