
Fig. 10.
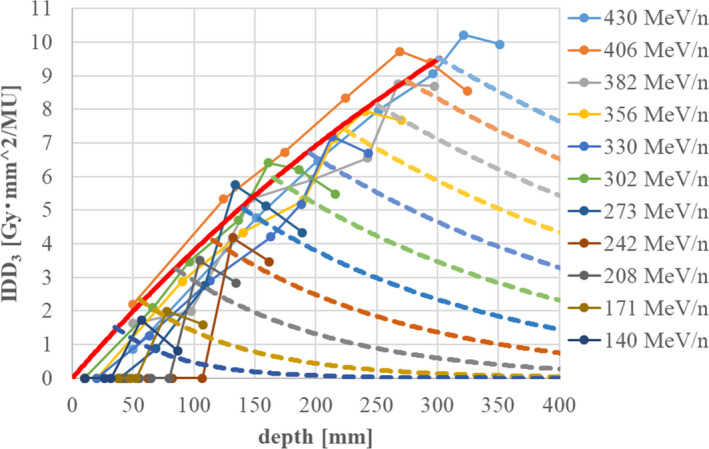
Fitting results for the IDD of the third component, IDD3(z). The red line shows the increasing component up to the Bragg‐peak depth, while the dashed lines show the decreasing components exceeding that depth.
Official websites use .gov
A
.gov website belongs to an official
government organization in the United States.
Secure .gov websites use HTTPS
A lock (
) or https:// means you've safely
connected to the .gov website. Share sensitive
information only on official, secure websites.
Fitting results for the IDD of the third component, IDD3(z). The red line shows the increasing component up to the Bragg‐peak depth, while the dashed lines show the decreasing components exceeding that depth.