
Fig. 17.
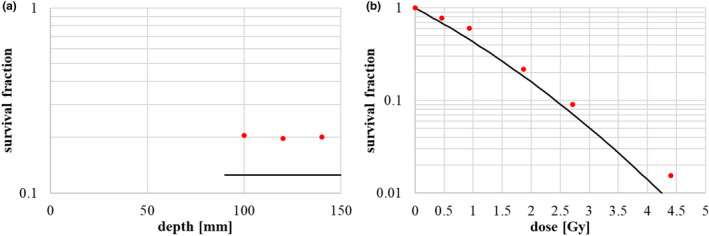
HSG cell survival measurement results: (a) survival in the SOBP flat region, and (b) dose dependency of survival at the center of the SOBP. The red points represent the measurement results and the lines represent the expected survival from calculation.