
Fig. 3.
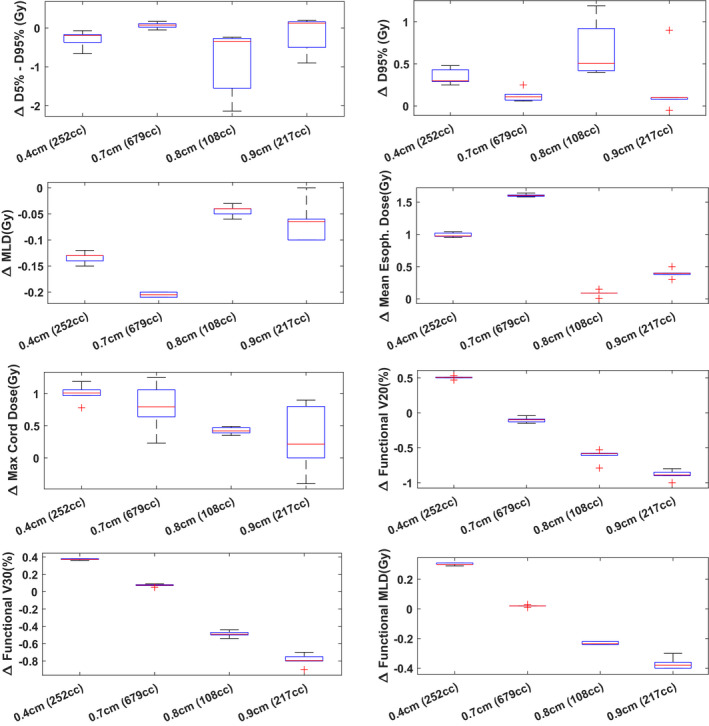
Dose metrics differences (nominal dose—4D dynamic dose) for a subset of lung patients (stages II to IV). A total of 6 single‐fraction interplay simulations were performed (combination of phase T0 start, phase T50 start, T = 3 s, T = 5 s, T = 7 s) per patient. Boxplots of the dose metrics differences are plotted here for each patient along with their maximum motion amplitude and tumor size