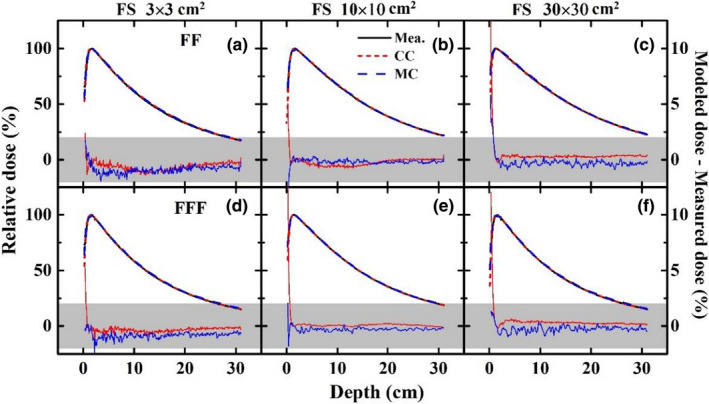
Fig. 7.

Agreements and relative differences of PDDs for 3 × 3 (left), 10 × 10 (middle), 30 × 30 (right) cm2 fields between TPS calculations (CC and MC) and beam measurements for 6XFF (a, b, c) and 6XFFF (d, e, f). The shaded area represents the region within a relative difference of 2% between the modeled dose and measured dose.
