Figure 1.
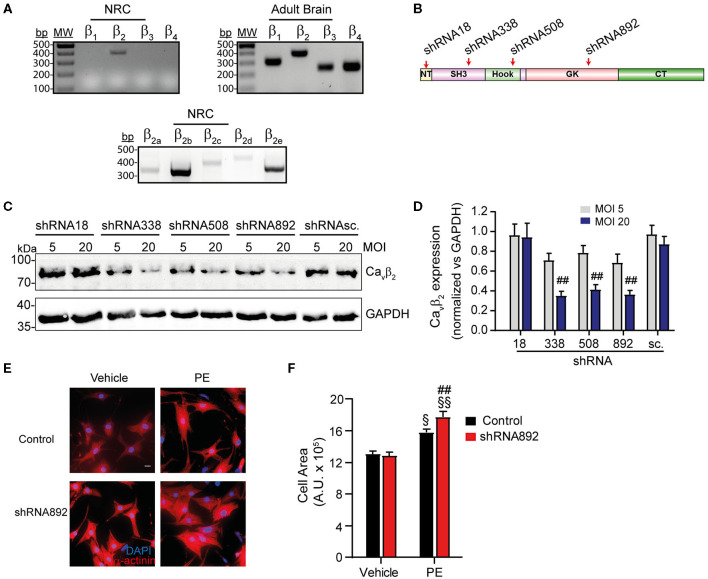
Cavβ2 downregulation enhances PE-induced hypertrophy of NRCs. (A) RT-PCR analysis of the expression of the four Cavβ isoforms in NRCs and adult brain. The lower panel shows the expression of the different Cavβ2 splice variants in NRCs. (B) Scheme of the domain organization of Cavβ2, showing the regions where the designed shRNAs bind: NT (N-terminal), SH3 (Src-3 homology domain), GK (guanylate kinase domain), CT (C-terminal). (C) Representative western blot analysis of Cavβ2 expression in homogenates from NRCs transduced with the different shRNAs for Cavβ2-silencing and the scrambled shRNA (shRNAsc) used as negative control. Cells were transduced with each shRNA at an adenoviral MOI of 5 or 20. Per lane, 50 μg of protein were loaded. An anti-GAPDH western blot was used as loading control. (D) Bar plot of Cavβ2 expression normalized vs. GAPDH in homogenates from NRCs transduced with the different shRNAs for Cavβ2-silencing and the scrambled shRNA (shRNAsc.) at an adenoviral MOI of 5 or 20. Mean ± SEM from 3 replicated experiments; ##p < 0.05 vs. shRNAsc treated at the same MOI (two-way ANOVA with Holm–Sidak's method). (E) Representative fluorescent images of control and Cavβ2-downregulated NRCs (shRNA892) treated with vehicle or 50 μM phenylephrine (PE). Red, α-actinin; Blue, nuclear staining. Scale bar represents 15 μm. (F) Bar plot of the mean values of the cell area of control and Cavβ2-downregulated NRCs (shRNA892) after treatments with vehicle or PE. Mean ± SEM; 150–200 cells per group from 20 randomly chosen fields from 4 replicated experiments were measured; §§p < 0.01 vs. vehicle-treated cells in the same group; §p < 0.05 vs. vehicle-treated cells in the same group; ##p < 0.05 vs. control treated similarly (two-way ANOVA with Holm–Sidak's method).

