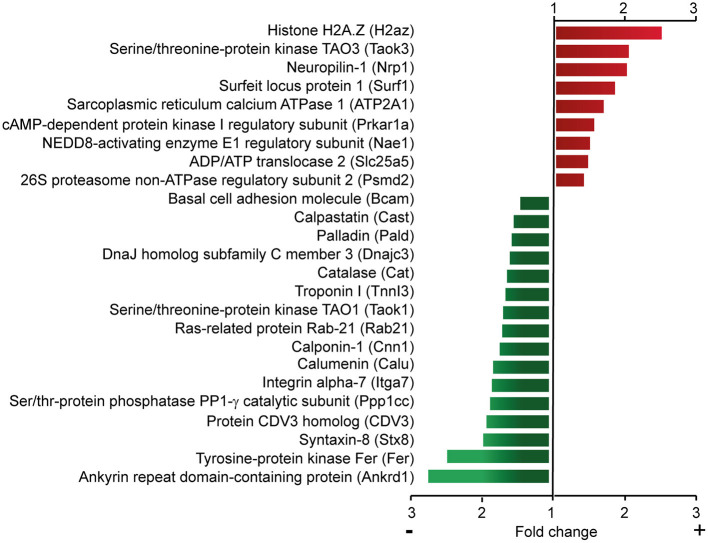
Figure 6.
Quantitative proteomic analysis of control and Cavβ2-downregulated NRCs. Subset of upregulated (red) or downregulated (green) proteins identified by quantitative mass-spectrometry-based analyses after Cavβ2 downregulation in NRCs. A complete list of proteins is provided in Supplementary Table 1.

