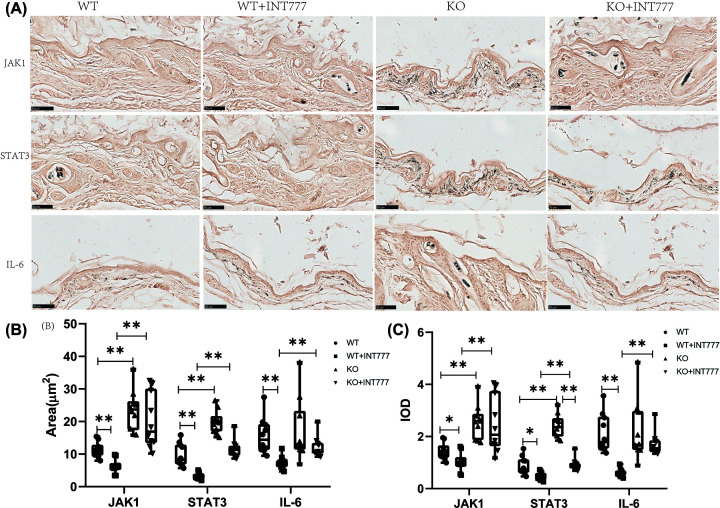
Figure 3. The effect of Tgr5 on Immunohistochemical results in Tgr5- mice.
(A) Immunohistochemical representation of JAK1,STAT3, and IL-6. (B) Positive cell area. (C) IOD. Data are expressed as the means ± standard deviation. One-way ANOVA followed by Tukey’s multiple tests has been used; n = 10 per group; * P<0.05, ** P<0.01. KO, knockout; WT, wild-type.

