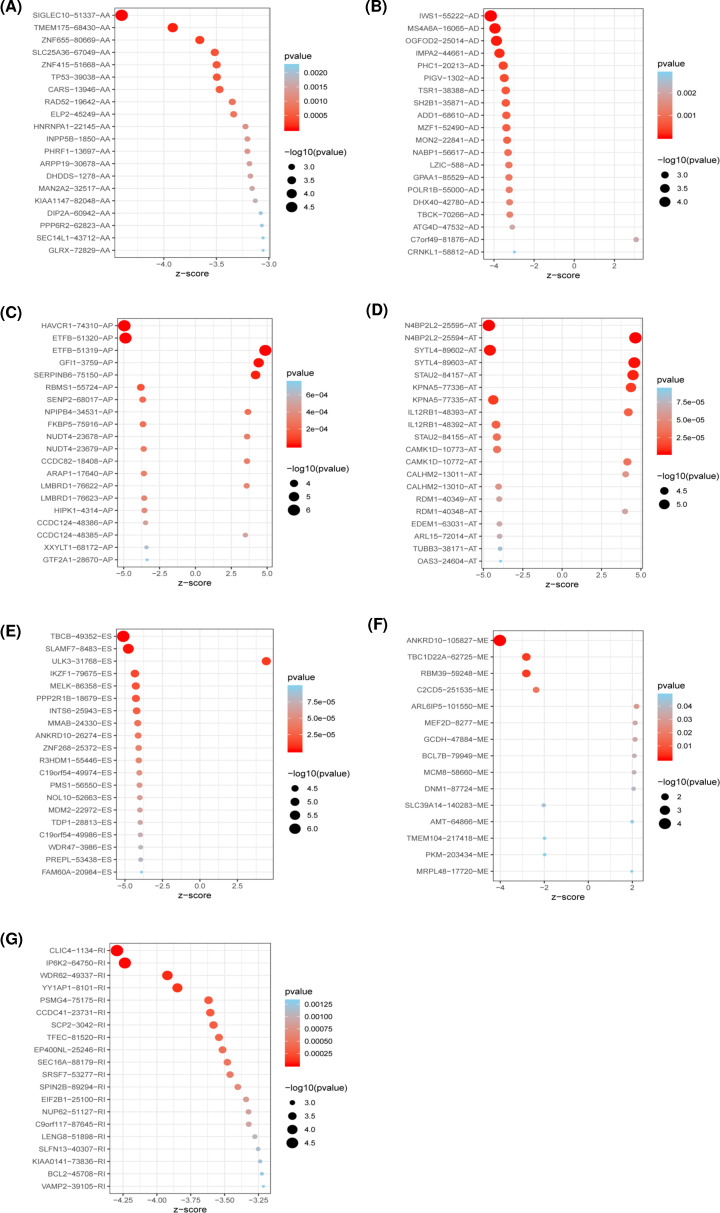
Figure 2. Forest plot of top 20 most significant OS-related AS events for each AS type (P<0.05).
(A–G) Z-score and P values of top 20 overall survival associated AA, AD, AP, AT, ES, ME, and RI events, respectively. The Z value represents the Wald statistic, and its value is equal to the regression coefficient coef divided by its standard error se (coef), P values indicate whether the AS event is significantly associated with patient's outcome.

