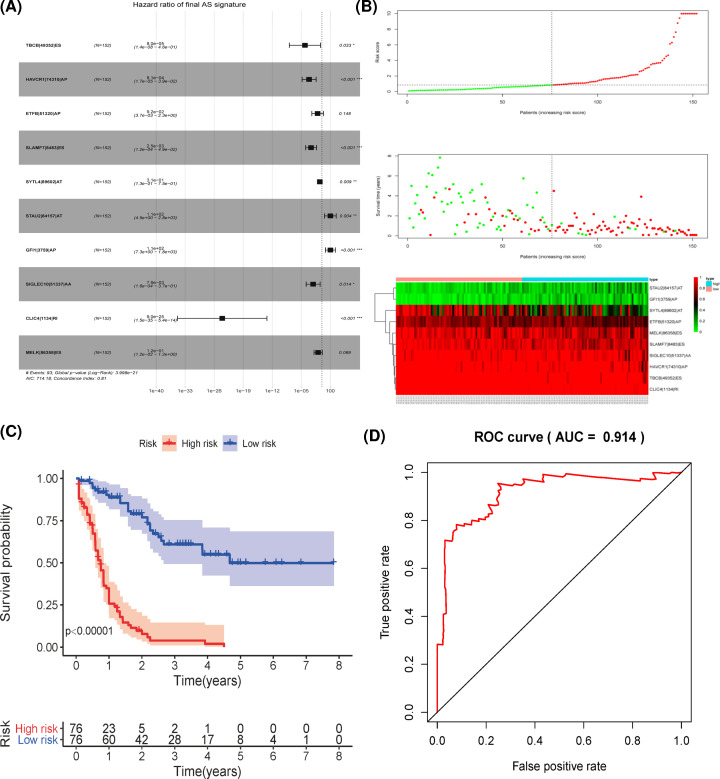
Figure 4. Development of the final prognostic signature based on the seven AS types.
(A) The hazard ratio of AS events in the final signature. (B) Distribution of patients’ risk scores, patients’ survival time, and the PSI value of the ten model AS events genes in high- and low-risk groups. (C) Kaplan–Meier curve of final prognostic signature built upon all seven types of AS events, in which red line indicates high-risk subgroup while blue line indicates low-risk subgroup (P<0.05). (D) The area under curve value of 3-year OS for the final signature.

