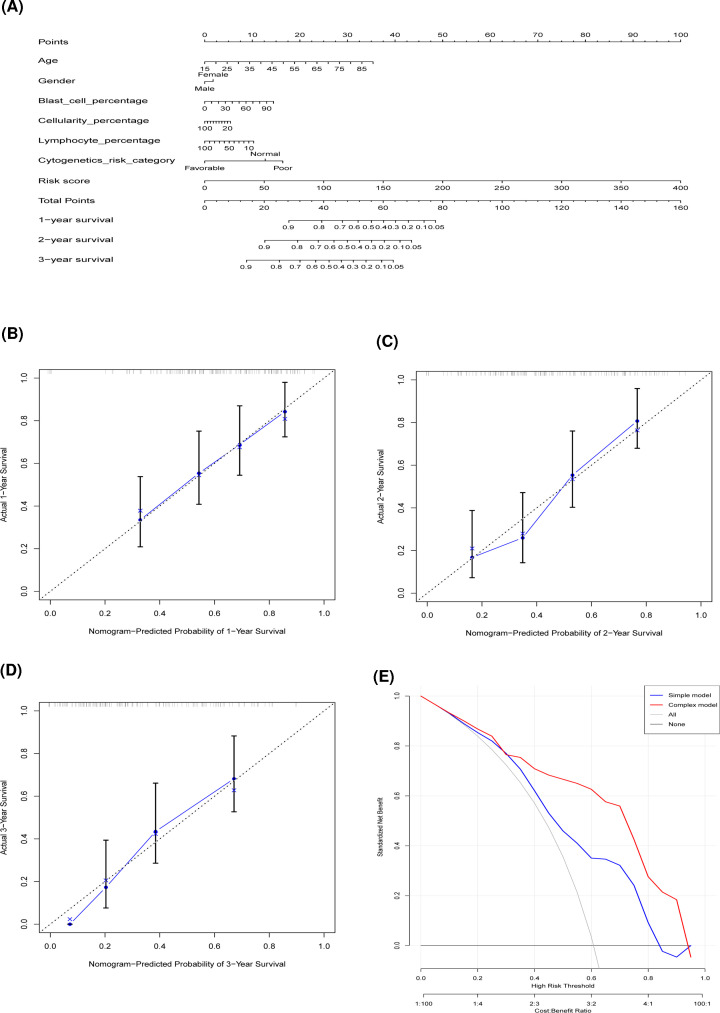
Figure 6. The AS-clinicopathologic nomogram for prediction on survival probability in patients with AML.
(A) Development of AS-clinicopathologic nomogram for predicting 1-, 2-, and 3-year OS for AML patients, with the final AS signature, age, gender, blast cell percentage, cellularity percentage, lymphocyte percentage, and cytogenetics risk category incorporated. (B–D) Calibration plot of the AS-clinicopathologic nomogram-predicted and observed 1-, 2-, 3-year survival in AML patients. The dashed line represents the ideal performance, and the actual performance of the final AS signature is shown by blue lines. (E) Decision curve analysis of the AS-clinicopathologic nomogram. The red line represents the net benefits of the final signature nomogram for predicting the OS for AML patients. The blue line stands for treat-all scheme varying with threshold probability, while the black line represents the net benefit of treat-no scheme.

