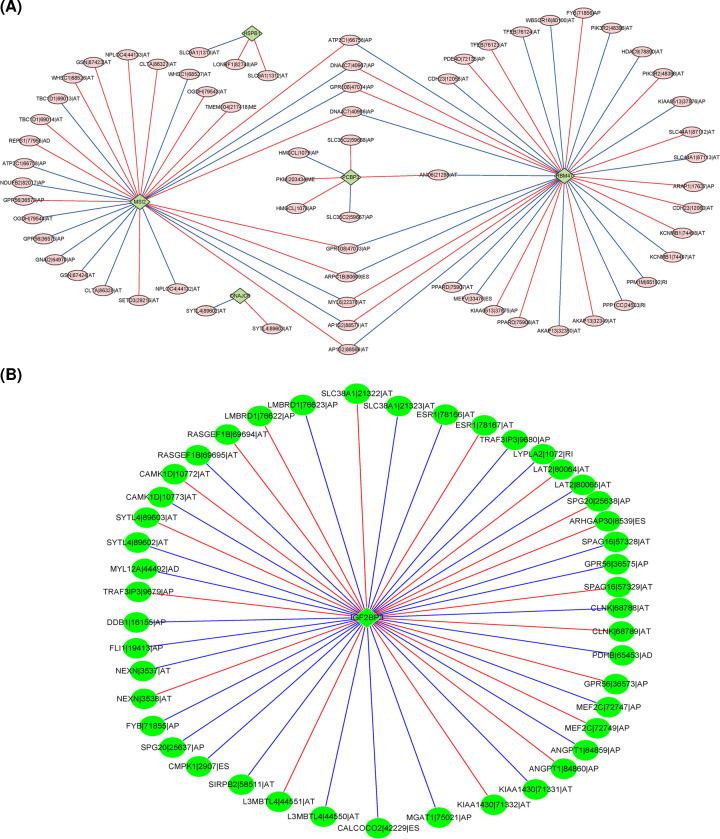
Figure 8. The correlation network of the SFs with OS-related AS events.
(A) The correlation network of the expression of SFs with the PSI values of OS-related AS events. Rhombus represents the SFs, and circle represents AS events. In addition, red line represents the positive correlation between SFs and AS events, blue line stands for the negative correlation between SFs and AS events. (B) The correlation network of the expression of OS-related SFs with the PSI values of OS-related AS events. Rhombus represents the survival-related SFs, and circle represents AS events. In addition, red line represents the positive correlation between SFs and AS events, blue line stands for the negative correlation between SFs and AS events.

