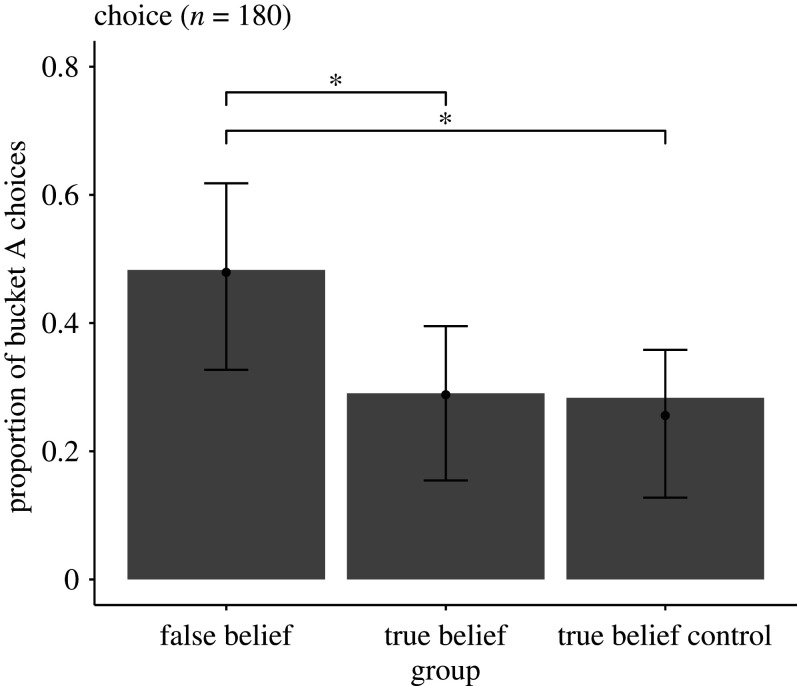
Figure 2.
Comparison between false and true belief groups from experiment 1 (left and middle column) and control true belief group from experiment 2 (right column). The plot shows on the y-axis the proportion of dogs that chose the suggested (empty) bucket A. The experimental group is shown on the x-axis. Black lines with asterisks show statistically significant differences between false belief group and both true belief groups (p < 0.05). Black dots indicate fitted values and error bars 95% confidence intervals. Dogs reacted in the same way across true belief groups and in a different way between false belief and true belief groups.

