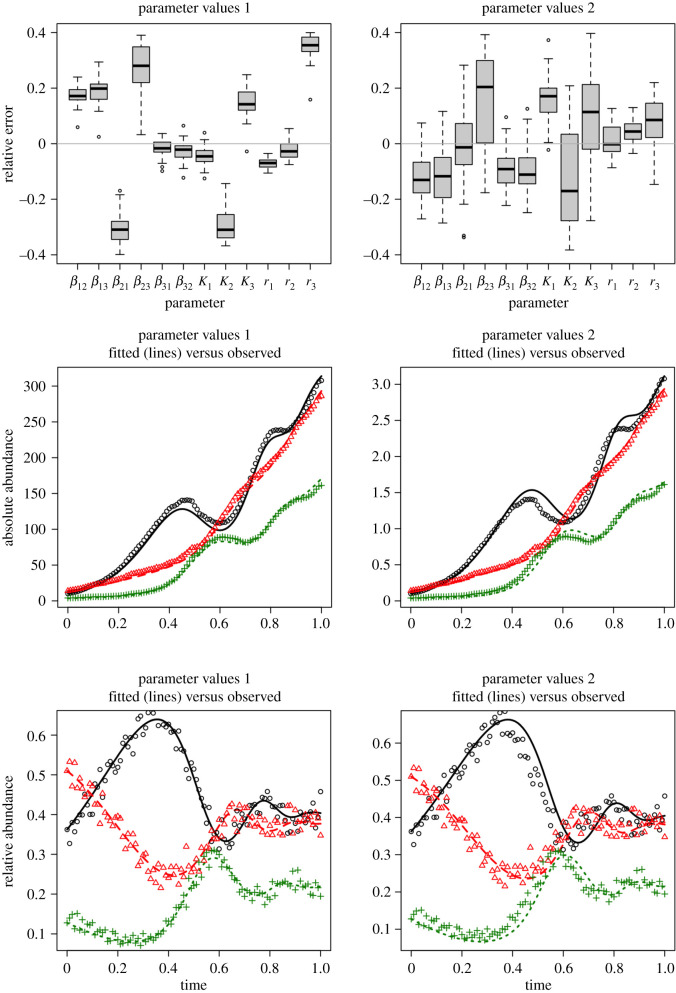
Figure 2.
Fits of the synthetic three-species gLV system with process and observation error. The left-hand column shows the results for the ‘value 1’ set of parameters (table 1), while the right-hand column shows the results for the ‘value 2’ set of parameters. Note that the scales for absolute abundance vary for the absolute abundances generated from the two sets of parameters. Fitting was done by starting the algorithm near the correct parameters set and giving it the correct total population size at t = 0 (N0 = 0.28 and N0 = 28, respectively). The fits for the relative abundance data are quite similar (last row), as are the extrapolated fits of the absolute abundance data (middle row). Relative error of the parameter estimates was defined as relative error , where x is the estimated value and is the true value. The relative error was bounded on [−0.4, 0.4] by the assumed priors.

