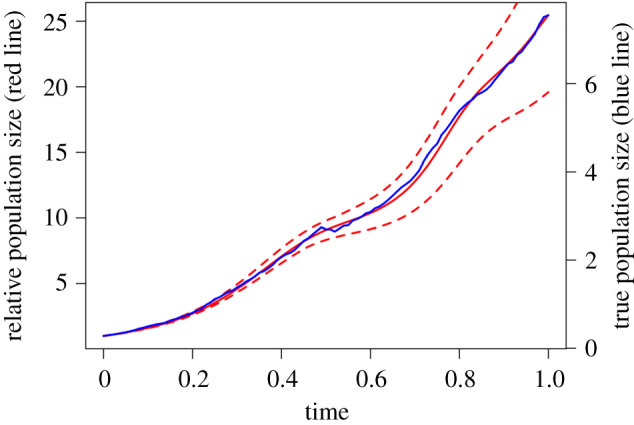
Figure 3.

Reconstruction of relative population size. If a model is fit where it is assumed that N0 = 1, then information is recovered about the fold-change in the population’s size over time. The mean estimate (solid red line) does a fairly good job of matching the stochastic population trajectory (blue line). The dashed red lines show the range of population values produced by numerically solving the three-species gLV system for all accepted parameter sets in the MCMC algorithm.
