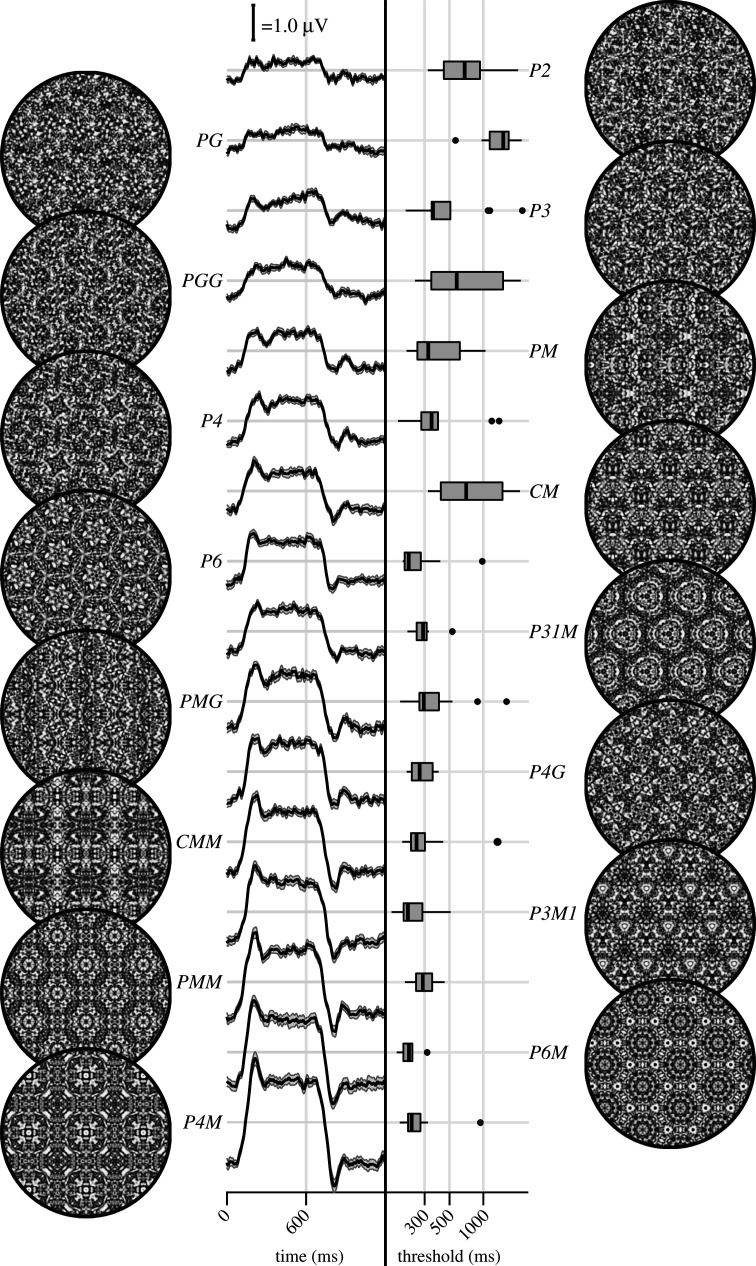
Figure 2.
Examples of each of the 16 wallpaper groups are shown in the left- and right-most column of the figures, next to the corresponding SSVEP (centre-left) and psychophysical (centre-right) data from each group. The SSVEP data are odd-harmonic-filtered cycle-average waveforms. In each cycle, a P1 exemplar was shown for the first 600 ms, followed by the original exemplar for the last 600 ms. Error bars are standard error of the mean. Psychophysical data are presented as boxplots reflecting the distribution of display duration thresholds. The 16 groups are ordered by the strength of the SSVEP response, to highlight the range of response amplitudes.

