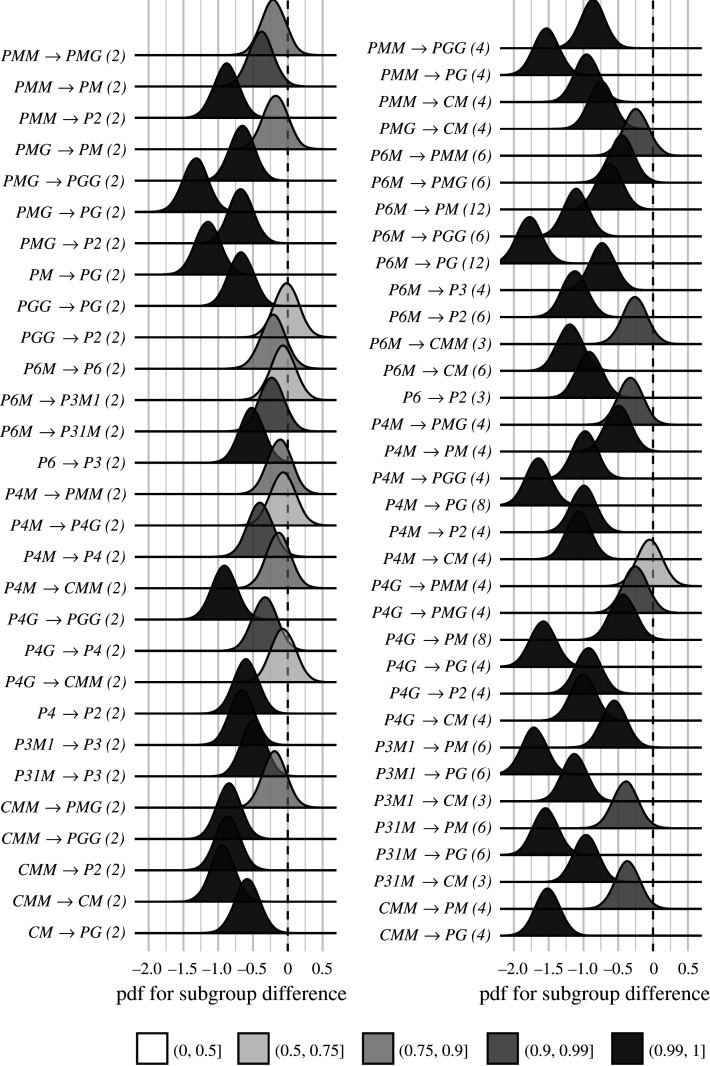
Figure 4.
Posterior distributions for the difference in mean symmetry detection threshold durations. Indices are shown in parentheses next to each subgroup relationship. The shading of the filled distribution relates to the conditional probability that the difference in means is smaller than zero. We can see that 43/63 subgroup relationships have p(Δ < 0 | data) > 0.99.

