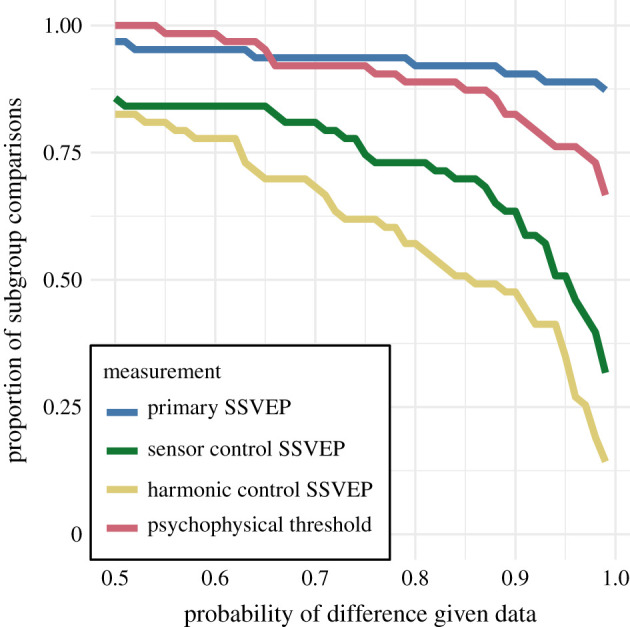
Figure 5.

Proportion of subgroup relationships that satisfy p(Δ > 0 | data) > x for the SSVEP data and p(Δ < 0 | data) > x for the psychophysical data. If we take x = 0.95 as our threshold, the subgroup relationships are preserved in and of the comparisons for the primary SSVEP and threshold duration datasets, receptively. This compares to and for the SSVEP control datasets. (Online version in colour.)
