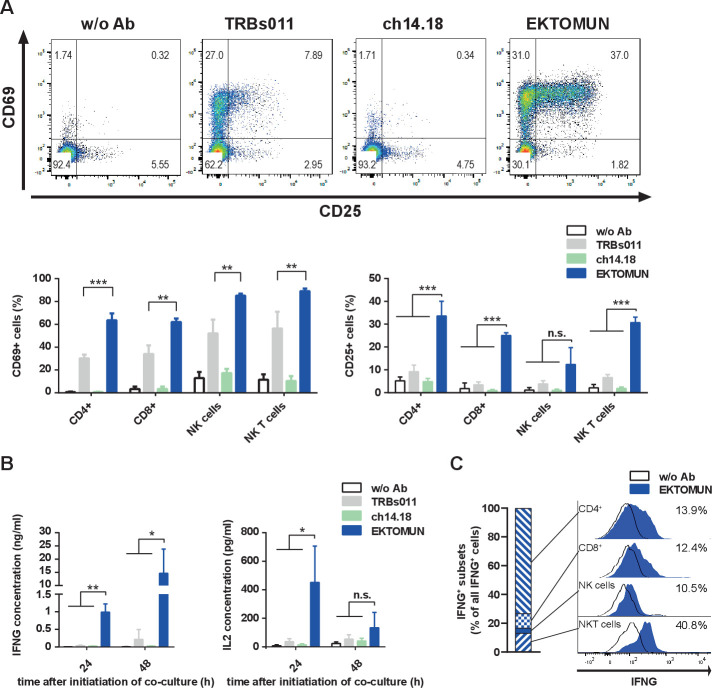
Figure 4.
EKTOMUN activates T cells and causes proinflammatory cytokine release. NB69 cells were treated with the trAbs EKTOMUN or TRBs011 or with the monoclonal ch14.18 antibody during coculture with PBMCs from a healthy donor. (A) Representative dot plots of CD69 and CD25 expression on living CD3+/CD56− cells as well as quantification of positive stained cells for CD69 (left panel) and CD25 (right panel) in different effector subpopulations are shown. (B) After 24 and 48 hours, the concentration of Interleukin 2 (IL2) and Interferon-γ (IFNG) in the conditioned media were determined by ELISA. Results are pooled medians of experimental triplicates of three independent experiments. (C) Representative histogram plots of intracellular IFNG production in different effector subpopulations. Definitions of subpopulations: CD4+:CD3+, CD4+, CD8−; CD8+:CD3+, CD4−, CD8+; NK cells: CD3−, CD56+; NKT cells: CD3+, CD56+. Ab: antibody; w/o: without. Student’s t-test; *p<0.05; **p<0.01; ***p<0.001; n.s., not significant.

