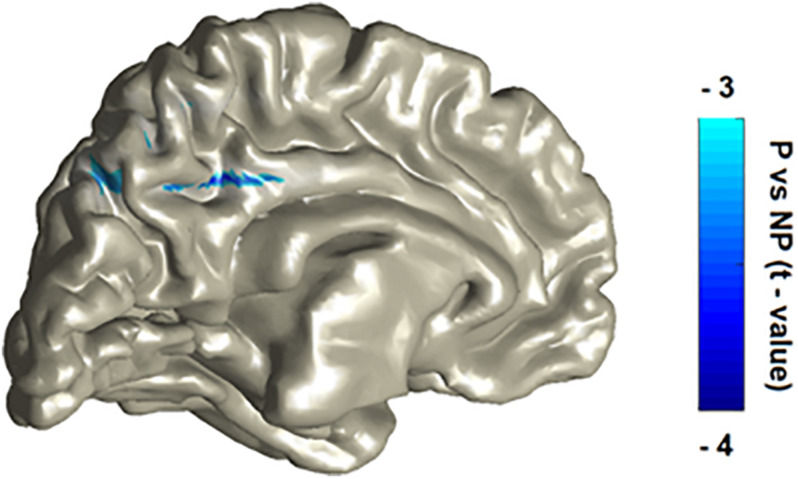
FIGURE 2.
P vs NP statistical contrast of the source localization of the beta suppression effect. The localization procedure reveals two main peaks, in the cingulate cortex and in the precuneus. The patterns were laid over on MNI template with a color bar representing masked and peak statistical activity (Pcluster–cor < 0.05).

