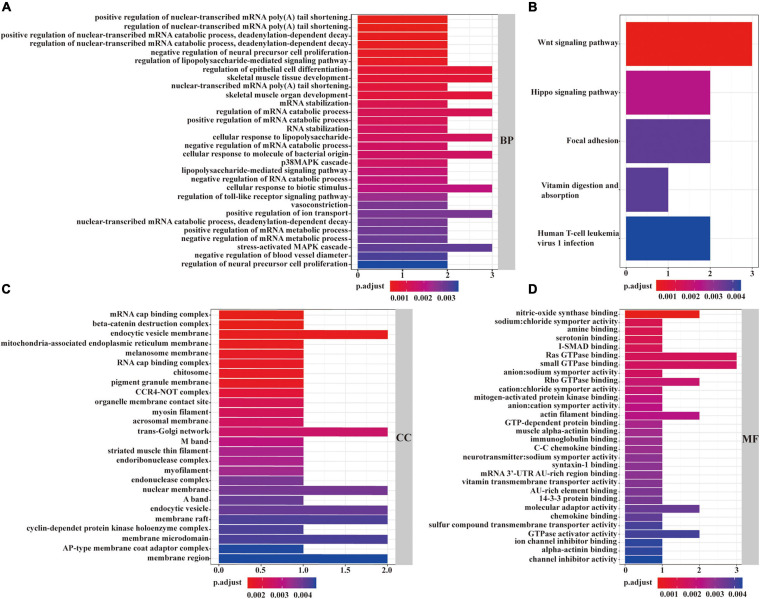
FIGURE 6.
GO and KEGG functional enrichment analyses of mRNAs in the ceRNA network. The enrichment of biological processes is shown in (A). The enrichment of cellular components was described in (C). The enrichment of molecular functions is displayed in (D). The enrichment analysis of KEGG pathways is shown in (B). A p < 0.05 was considered to indicate a statistically significant difference.

