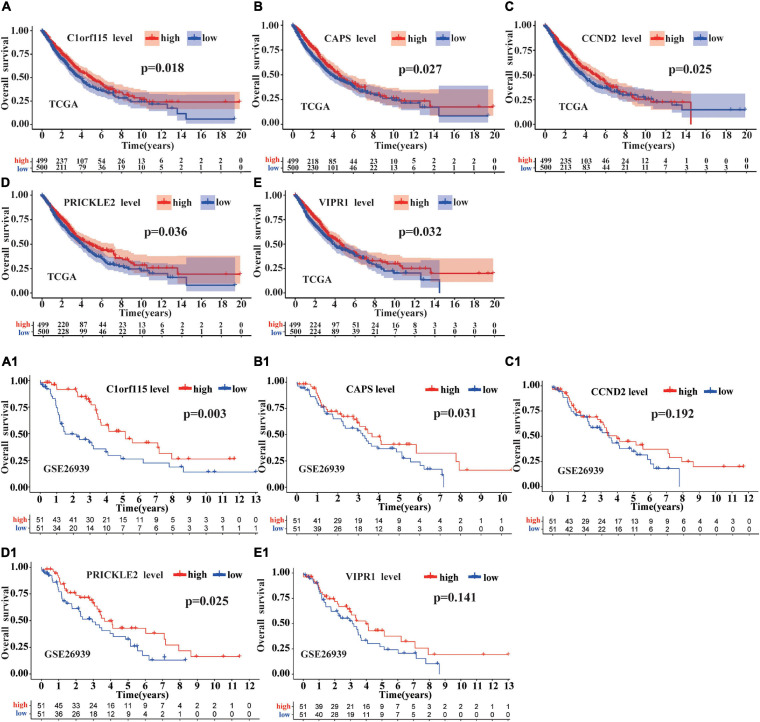
FIGURE 7.
Survival analysis of mRNAs in ceRNA regulatory network. The survival prognosis of 22 mRNAs was analyzed based on the TCGA database. As shown in (A), compared with the group with low C1orf115 expression, the group with high C1orf115 expression had a better prognosis in LUAD (p = 0.018). As displayed in Panels (B–E), we have reached the same conclusion for CAPS, CCND2, PRICKLE2, and VIPR1 (p = 0.027, p = 0.025, p = 0.036, and p = 0.032). As depicted in (A1), (B1), (C1), (D1), and (E1), based on GSE26939 array from the GEO database, only C1orf115, CAPS, and PRICKLE2 (p = 0.003, p = 0.031, and p = 0.025) have been verified to be consistent with the above conclusions.

