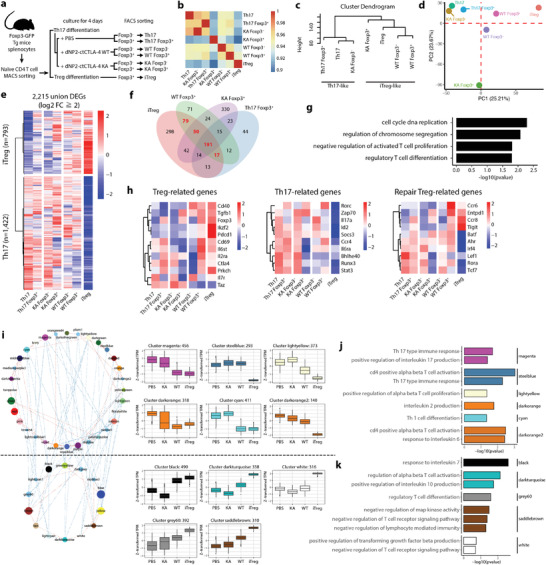
Figure 3.

Transcriptome analysis of Foxp3 positive cells induced by dNP2‐ctCTLA‐4 showing the similarity of these cells to iTreg. a) Scheme of RNA‐seq sample preparation. Foxp3 was induced by 2 × 10⁻⁶ m of peptide under Th17 conditions. b–d) The distance between samples was visualized by b) a heatmap of the correlation coefficient between samples, c) a dendrogram based on the “average method,” and d) a PCA plot using 34 432 expressed transcripts. e) A heatmap of differentially expressed genes (DEGs, log2‐fold change ≥ 2 & FDR < 0.01) was drawn to compare Th17 and iTregs. f,g) dNP2‐ctCTLA‐4‐treated Foxp3+ Th17 cells showed an iTreg‐like transcription pattern. f) Venn diagram of upregulated genes versus Th17 and g) bar plot of significantly enriched (FDR < 0.2) GO terms for genes commonly upregulated in iTregs and WT Foxp3+ cells (log2 fold change ≥2 vs Th17). h) Comparison of expression of Treg‐related, Th17‐related, and repair Treg‐related genes among samples. i) Coexpression network of module eigengene vectors (left) and boxplot showing scale‐normalized (Z‐score) expression of modulized genes (blue line: correlation coefficient < −0.5; red line, correlation coefficient > 0.5; node color, color‐labeled modules; node size, number of genes in each module). j,k) Significantly enriched functions of upregulated modular genes in j) Th17 cells and k) iTregs.
