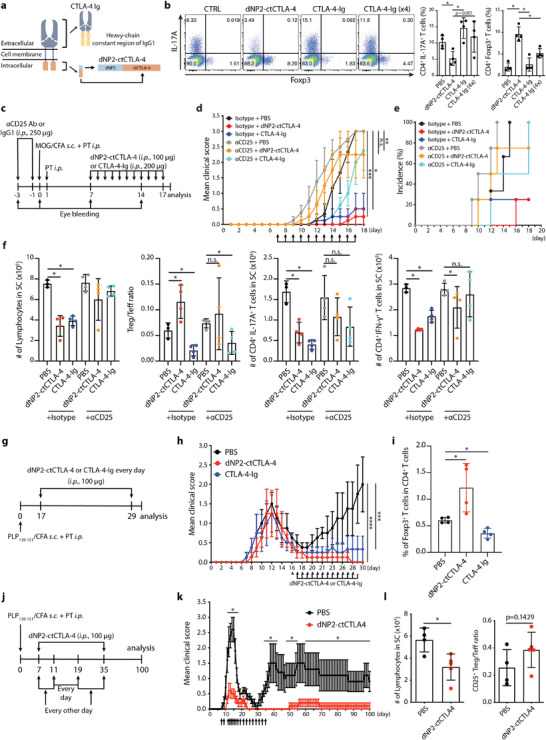
Figure 5.

CTLA‐4 signaling peptide but not CTLA‐4‐Ig inhibits EAE progression via Treg induction and prevents relapse. a) Schematic images of CTLA‐4‐Ig and the synthetic CTLA‐4 signaling peptide. b) Representative dot plot (left) and bar graph (right) of Foxp3 induction. Mouse naïve CD4 T cells were cultured with irradiated splenocytes under Th17 differentiation conditions. Cells were treated with 5 × 10⁻⁶ m CTLA‐4 signaling peptide or 0.5 × 10⁻⁶ m or 2 × 10⁻⁶ m CTLA‐4‐Ig for 3 days (n = 4). c–f) Tregs were depleted by α‐CD25 antibody treatment (250 µg, injected 3 days and 1 day before immunization, i.p.) before EAE induction by MOG35–55 in CFA emulsion with PTX. After immunization, B6 mouse were treated with CTLA‐4 signaling peptide (100 µg, i.p.) or CTLA‐4‐Ig (200 µg, i.p.) from days 7 to 17 (4 mice per group). c) Experimental scheme showing establishment of a Treg‐depleted EAE mouse model treated with CTLA‐4 signaling peptide. d) Clinical score of Treg‐depleted EAE mice. e) EAE incidence of Treg depleted EAE model. f) Number of infiltrated lymphocytes (left), Treg/Teff ratio (middle), number of CD4+ IL‐17A+ T cells (middle), and CD4+ IFN‐γ + T cells (right) in the spinal cord were analyzed on day 18. g–i) EAE was induced in SJL mice by treatment with PLP139–151 in a CFA emulsion with PTX. After immunization, mice were treated with CTLA‐4 signaling peptideor CTLA‐4‐Ig (100 µg, i.p.) during the relapse phase, from day 17 to 29 (4 mice per group). g) Experimental scheme of the relapsing‐remitting EAE (SJL mouse) model. h) Clinical score of the relapsing‐remitting EAE model. i) Percent of Foxp3+ cells among CD4+ T cells in the spinal cord was analyzed on day 30. j–l) SJL was induced in mice by PLP139–151 in CFA emulsion with PTX. After immunization, mice were treated with CTLA‐4 signaling peptide (100 µg, i.p.) from day 7 (4–5 mice per group, representative data from two independent experiments). j) Experimental scheme of the relapsing‐remitting EAE mouse model. k) Clinical score of relapsing‐remitting EAE mice. l) Number of lymphocytes (left) and ratio of CD25+ Treg/Teff (right) in the spinal cord were analyzed on day 100. Data are presented as mean ± S.E.M. in d,h,k) and mean ± S.D. in b,f,i,l). Statistical significance was determined by Mann–Whitney test in b,f,i,k,l) or Friedman test with post‐hoc Dunn's test in d,h) n.s. = nonsignificant, *p < 0.05, **p < 0.01, ***p < 0.001, ****p < 0.0001.
