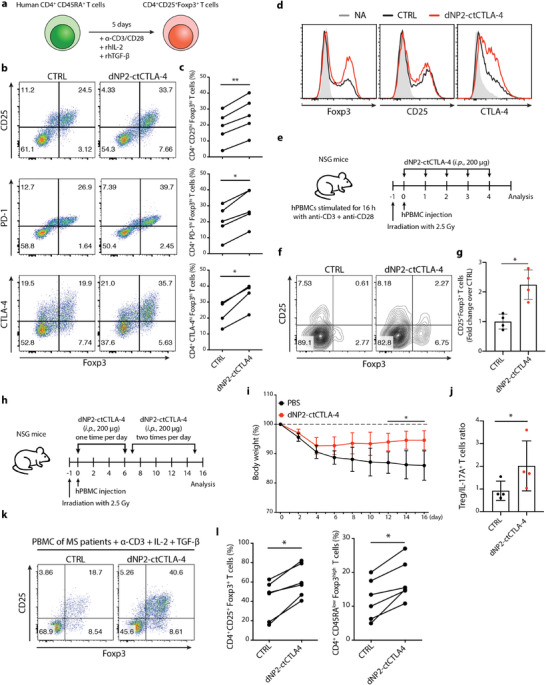
Figure 6.

CTLA‐4 signaling peptide increases human Treg cells from healthy donors and MS patients. a–d) Human CD4+ CD45RA+ T cells were stimulated with human anti‐CD3/CD28 mAb under Treg differentiation conditions in the presence of 4 × 10⁻⁶ m CTLA‐4 signaling peptide for 5 days (n = 5). a) Experimental scheme of human naive T cell differentiation under Treg differentiation conditions. b) Representative flow cytometry data and c) line graph of CD4+ CD25high Foxp3high T cells, CD4+ PD‐1high Foxp3high T cells, and CD4+ CTLA‐4high Foxp3high T cells. d) Treg markers including Foxp3, CD25, and CTLA‐4 were expressed as a histogram to compare the Treg population proportions and Foxp3 staining intensity. e–g) In vivo human Foxp3+ Treg induction in NSG mice (4 mice per group, two independent experiments). e) Experimental scheme of the NSG mouse model. Human PBMCs were stimulated overnight and injected into irradiated NSG mice at day 0. The dNP2‐ctCTLA‐4 peptide (200 µg, i.p.) was injected into NSG mice on days 0–4. f) Representative flow cytometry data and g) bar graph of CD25+ Foxp3+ T cells isolated from the spleens of NSG mice on day 5. h–j) In vivo human Foxp3+ Treg induction in the GvHD model (4 mice per group, representative data from two independent experiments). h) Experimental scheme of the GvHD mouse model. Irradiated NSG mice were injected 24 h later with PBMC (2.5 × 10⁶ cells, i.v.). The CTLA‐4 signaling peptide (200–400 µg, i.p.) was injected into NSG mice from day 0 to 15. i) Body weight of the GvHD mouse model. j) Bar graph of Treg/IL‐17A cells ratio isolated from the spleens of NSG mice on day 16. k,l) PBMCs from MS patients were stimulated with human anti‐CD3 mAb under Treg differentiation conditions in the presence of 4 × 10⁻⁶ m CTLA‐4 signaling peptide for 3 days. CD4+ CD25+ Foxp3+ and CD4+ CD45RAlow Foxp3high functional Tregs were analyzed by flow cytometry (n = 6). k) Representative flow cytometry data and l) line graph of CD25+ Foxp3+ T cells and CD45RAlow Foxp3high T cells. Data are presented as mean ± S.E.M. in i) and mean ± S.D. in g,j). Statistical significance was determined by Wilcoxon test in c,l), or Mann–Whitney test in g,i,j). n.s. = nonsignificant, *p < 0.05, **p < 0.01.
