
Figure 1.
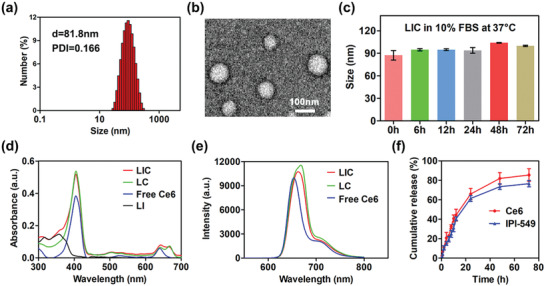
Characterization of nanodrugs. a) The size distribution of LIC. b) Transmission electron microscope (TEM) image of LIC. c) Stability of LIC in phosphate buffer saline (PBS) containing 10% FBS at 37 °C (n = 3). d) UV–vis absorption spectra of LIC, LC, free Ce6, and LI. e) Fluorescence spectra of LIC, LC, and free Ce6. f) Cumulative release of Ce6 and IPI‐549 from LIC at pH 6.5 (n = 3).