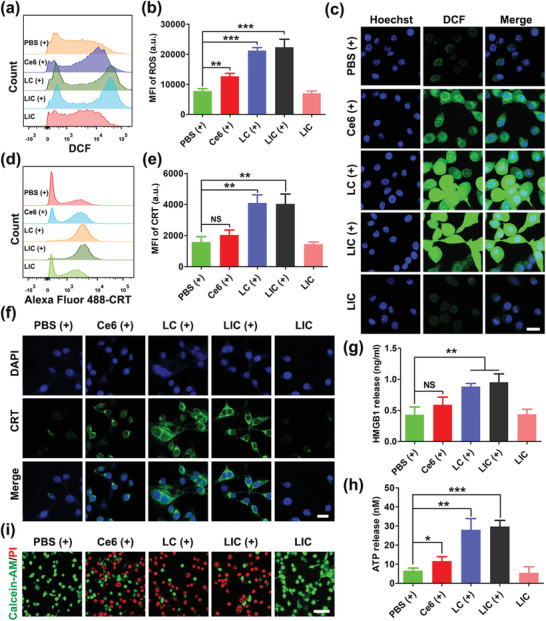
Figure 3.

PDT‐mediated cytotoxicity and immunogenic cell death (ICD) in CT26 cells in vitro. a) Flow cytometry detection of ROS production in CT26 cells after various treatments. b) Statistical analysis of ROS generation (n = 3). c) Confocal imaging of ROS (green) production in CT26 cells after different treatments. Scale bar: 25 µm. d) Flow cytometry detection of ICD signal CRT expression on CT26 cells after various treatments. e) Statistical analysis of CRT expression (n = 3). f) Confocal imaging of CRT (green) expression on the surface of CT26 cells after different treatments. Scale bar: 25 µm. g) Determination of HMGB1 release after different treatments (n = 3). h) Detection of ATP secretion after different treatments (n = 3). i) CLSM images of live (green) and dead (red) CT26 cells after various treatments. Scale bar: 50 µm. (+) indicates 660 nm (0.8 W cm−2, 1 min) light irradiation. **p < 0.01, ***p < 0.001, NS: no significant difference.
